Get help with Mathematics 20-3
Most tutoring makes you sit through material you already know. MapleMind flips that: pick the exact skill that's causing trouble — any of the 26 below — and the tutor teaches just that one, step by step, as many times as it takes. Ask questions in plain words, any time of day, in English, French, or 12 other languages.
The official Alberta Mathematics 20-3 curriculum
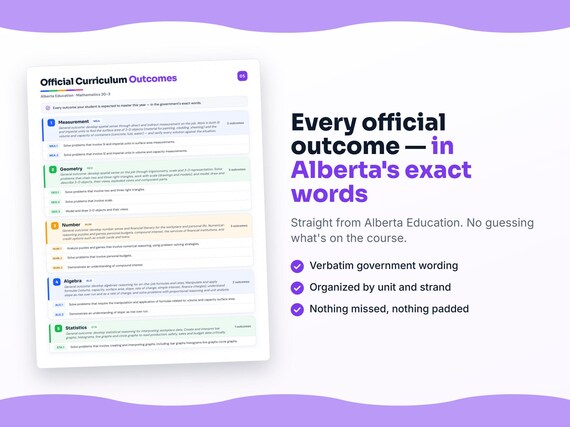
Alberta defines Mathematics 20-3 by strands and outcomes. MapleMind teaches the same curriculum reorganized for one-skill-at-a-time tutoring — the table shows exactly where every official strand lands, and the ministry's own wording is quoted under each unit below.
Official source Alberta's official programs of studyRead it on the government site — alberta.ca ↗| Official strand | Outcomes | Where MapleMind teaches it |
|---|---|---|
| Measurement | 2 | Measurement |
| Geometry | 4 | Geometry |
| Number | 5 | Number |
| Algebra | 3 | Algebra |
| Statistics | 1 | Statistics |
Every skill below, taught one on one.
 Try the first session free
How MapleMind teaches Mathematics 20-3 — every unit, lesson, and skill
Every skill below runs as a short session: a plain-words lesson, a worked example, solving it together, then a five-question skill check that earns up to three stars. Guided Mode keeps it teaching instead of answer-handing — turning it off needs a parent's password.
Unit 1MeasurementOfficial strand · Measurement
General outcome: develop spatial sense through direct and indirect measurement on the job. Work in both SI and imperial units to find the surface area of 3-D objects (material for painting, cladding, sheeting) and the volume and capacity of containers (concrete, fuel, water) — and verify every solution against the situation.
Surface Area for Materials (SI & Imperial)
- Surface area in SI and imperial units20-3.M.1 — Calculate the surface area of right prisms, cylinders and composite trade objects in both SI (m², cm²) and imperial (ft², in²) units to estimate material such as paint, drywall or sheet metal.
- Verifying surface-area solutions20-3.M.1 — Check a surface-area answer for reasonableness on the job — confirm units, estimate before computing, and verify the solution accounts for waste, openings and overlaps.
Volume and Capacity (SI & Imperial)
- Volume in SI and imperial units20-3.M.2 — Find the volume of prisms, cylinders and composite objects (a concrete footing, a truck box, a tank) in SI (m³, cm³) and imperial (ft³, yd³) units for ordering materials.
- Capacity of containers20-3.M.2 — Determine the capacity of tanks and containers (litres, gallons) and convert between capacity and volume units to plan fuel, water or fluid quantities on the job.
The official wording — 2 outcomes in this unit
- 20-3.M.1
Solve problems that involve SI and imperial units in surface area measurements.
- 20-3.M.2
Solve problems that involve SI and imperial units in volume and capacity measurements.
Unit 2GeometryOfficial strand · Geometry
General outcome: develop spatial sense on the job through trigonometry, scale and 3-D representation. Solve problems that chain two and three right triangles, work with scale (drawings and models), and model, draw and describe 3-D objects, their views, exploded views and component parts.
Trigonometry on the Job (Two & Three Triangles)
- Problems with two right triangles20-3.G.1 — Solve applied problems (rafter runs, ramp heights, guy wires) that require setting up and solving two connected right triangles with the primary trigonometric ratios.
- Problems with three right triangles20-3.G.1 — Chain three right triangles to solve multi-stage trade problems, carrying a side or angle found in one triangle into the next.
Scale Drawings and Scale Models
- Reading and using scale20-3.G.2 — Use a stated scale (e.g. 1:50) to read real dimensions off a blueprint or map, and to lay out a full-size object from a scaled drawing.
- Determining and applying a scale20-3.G.2 — Choose an appropriate scale, produce a scaled drawing or model of a real object, and solve for a missing scale, drawing length or actual length by proportion.
3-D Objects, Views and Exploded Diagrams
- Modelling and drawing 3-D views20-3.G.3 — Model a 3-D object and draw its top, front and side views (orthographic views), and rebuild a 3-D object from a given set of views.
- Exploded views and component parts20-3.G.4 — Draw and describe an exploded view of a simple 3-D object, identifying its component parts and how they assemble — the language of an assembly diagram.
- Scale diagrams of 3-D objects20-3.G.4 — Draw and describe a scale diagram of a simple 3-D object, stating the scale and reading dimensions from it.
The official wording — 4 outcomes in this unit
- 20-3.G.1
Solve problems that involve two and three right triangles.
- 20-3.G.2
Solve problems that involve scale.
- 20-3.G.3
Model and draw 3-D objects and their views.
- 20-3.G.4
Draw and describe exploded views, component parts.
Unit 3NumberOfficial strand · Number
General outcome: develop number sense and financial literacy for the workplace and personal life. Numerical-reasoning puzzles and games, personal budgets, compound interest, the services of financial institutions, and credit options such as credit cards and loans.
Puzzles and Games with Numerical Reasoning
- Strategies for numerical puzzles and games20-3.N.1 — Analyze puzzles and games built on numerical reasoning (magic squares, target-number games, number tricks), choosing and applying problem-solving strategies.
- Justifying a numerical strategy20-3.N.1 — Determine, describe and justify a winning or optimal numerical strategy, explaining why it works rather than that it worked once.
Personal Budgets
- Building a personal budget20-3.N.2 — Build a personal budget from net (take-home) income and fixed plus variable expenses, and decide whether it balances, runs a surplus or a deficit.
- Adjusting a budget to a goal20-3.N.2 — Adjust a personal budget to reach a savings goal or absorb a change in income or expenses, using a spreadsheet or table.
Compound Interest, Financial Services and Credit
- Understanding compound interest20-3.N.3 — Demonstrate an understanding of compound interest — how interest earns interest over time — and compute the future value of savings or the cost of a balance using technology.
- Services of financial institutions20-3.N.4 — Demonstrate an understanding of the services financial institutions offer to access and manage finances — chequing and savings accounts, debit and online banking, fees and transfers.
- Credit cards20-3.N.5 — Demonstrate an understanding of credit cards — how a statement, minimum payment, interest and credit limit work, and the true cost of carrying a balance.
- Loans20-3.N.5 — Demonstrate an understanding of loans — principal, term, interest rate and regular payment — and compare loan options for a vehicle or major purchase.
The official wording — 5 outcomes in this unit
- 20-3.N.1
Analyze puzzles and games that involve numerical reasoning, using problem-solving strategies.
- 20-3.N.2
Solve problems that involve personal budgets.
- 20-3.N.3
Demonstrate an understanding of compound interest.
- 20-3.N.4
Demonstrate an understanding of financial institution services used to access and manage finances.
- 20-3.N.5
Demonstrate an understanding of credit options, including: credit cards.
Unit 4AlgebraOfficial strand · Algebra
General outcome: develop algebraic reasoning for on-the-job formulas and rates. Manipulate and apply formulas (volume, capacity, surface area, slope, rate of change, simple interest, finance charges), understand slope as rise over run and as a rate of change, and solve problems with proportional reasoning and unit analysis.
Rearranging and Applying Formulas
- Rearranging a formula for a variable20-3.A.1 — Manipulate a formula for volume, capacity or surface area to isolate any variable, then substitute to solve a trade problem.
- Applying finance and rate formulas20-3.A.1 — Apply formulas for simple interest, finance charges, slope and rate of change to solve workplace and personal-finance problems.
Slope, Rate of Change and Proportional Reasoning
- Slope as rise over run20-3.A.2 — Demonstrate an understanding of slope as rise over run — compute the slope of a ramp, roof or grade and read it as a ratio or percent grade.
- Slope as a rate of change20-3.A.2 — Demonstrate an understanding of slope as a rate of change — interpret slope as pay per hour, cost per unit or speed by solving problems.
- Proportional reasoning and unit analysis20-3.A.3 — Solve problems by applying proportional reasoning and unit analysis — set up proportions, track units through conversions, and check the result has the right unit.
The official wording — 3 outcomes in this unit
- 20-3.A.1
Solve problems that require the manipulation and application of formulas related to: volume and capacity surface area.
- 20-3.A.2
Demonstrate an understanding of slope: as rise over run.
- 20-3.A.3
Solve problems by applying proportional reasoning and unit analysis.
Unit 5StatisticsOfficial strand · Statistics
General outcome: develop statistical reasoning for interpreting workplace data. Create and interpret bar graphs, histograms, line graphs and circle graphs to read production, safety, sales and budget data critically.
Creating and Interpreting Graphs
- Creating the right graph for the data20-3.S.1 — Create bar graphs, histograms, line graphs and circle graphs from workplace data, choosing the graph type that fits the data and the message.
- Interpreting graphs critically20-3.S.1 — Interpret bar graphs, histograms, line graphs and circle graphs to draw conclusions from workplace data, and spot misleading scales or displays.
The official wording — 1 outcome in this unit
- 20-3.S.1
Solve problems that involve creating and interpreting graphs, including: bar graphs histograms line graphs circle graphs.
Printable workbook · A keepsake of the year
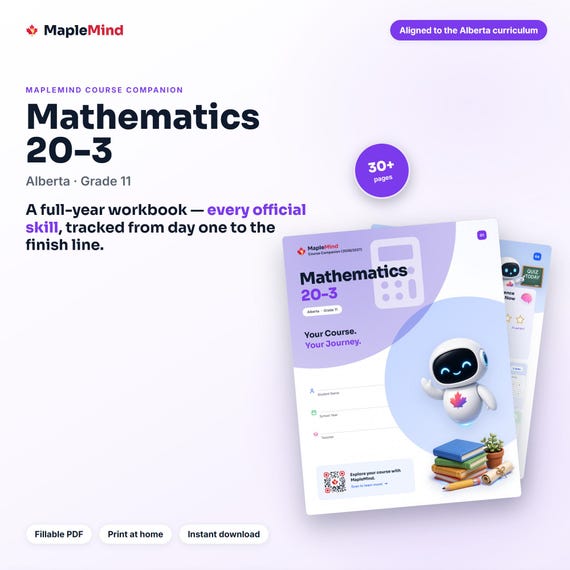
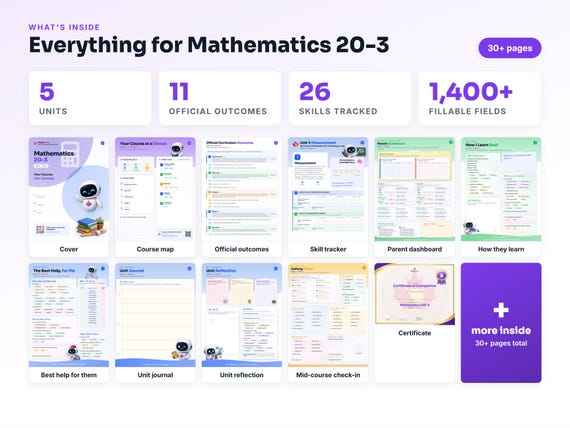
A Mathematics 20-3 workbook worth keeping
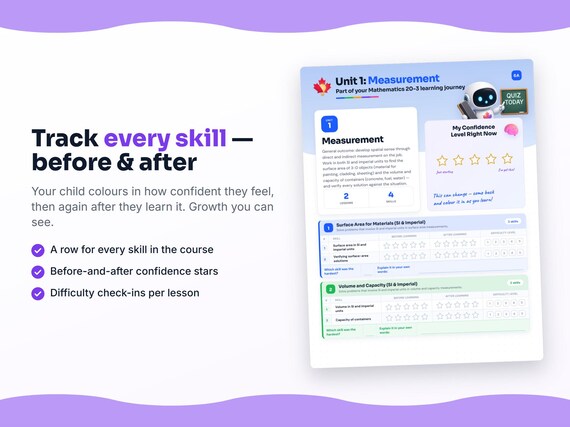
Built from the same official curriculum as this page. Before and after each skill above, your student colours in how sure they feel — so the two of you can see, on one page, what's clicking and what needs another look. It's a quiet way to follow how the year is really going.
By June it's full of their own handwriting: units worked through, confidence grown, a mid-year check-in, notes from parent-teacher night, and a certificate at the end. Less a worksheet, more a record of the year worth keeping on the shelf.
Instant download · see every page, reviews and the full description · five or more workbooks are $2.99 each
What it looks like in the app
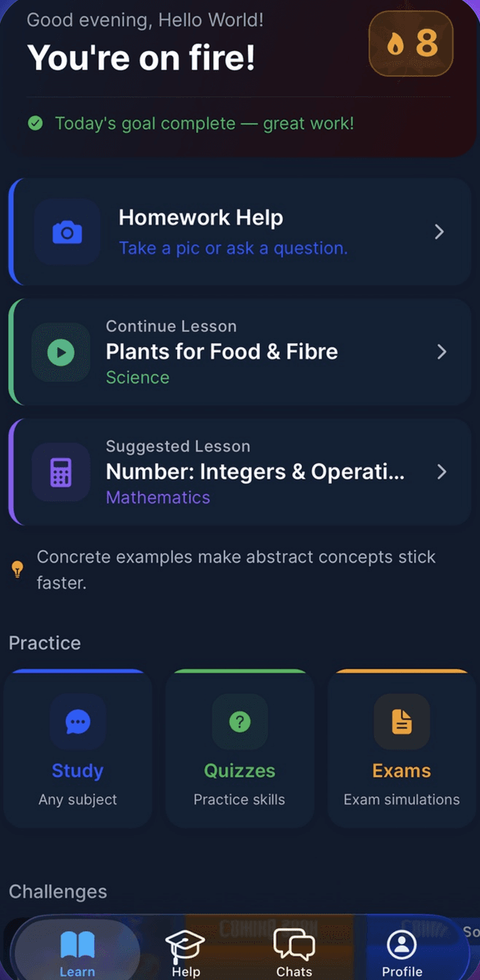
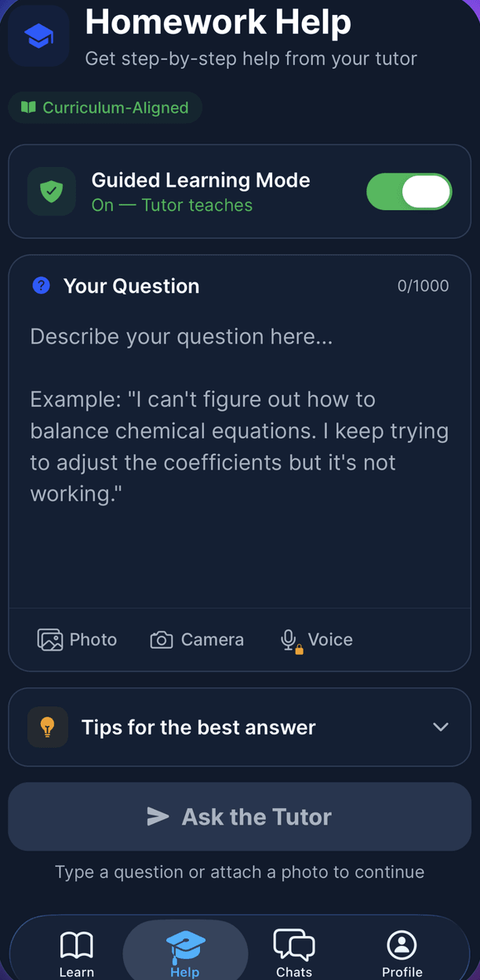
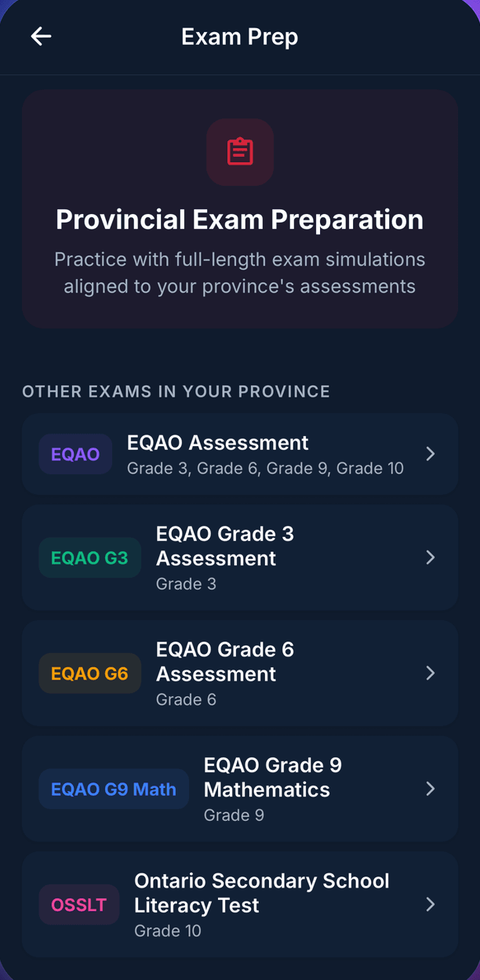
Common questions
Can MapleMind help me with Mathematics 20-3?
Yes. MapleMind's AI tutor covers all 26 skills in Alberta's Mathematics 20-3 — you pick the exact skill, and the tutor teaches it step by step: a short lesson, a worked example, solving together, then a skill check to show it stuck.
Is MapleMind aligned to Alberta's official curriculum?
Yes. Every skill in this course maps to an official outcome code from Alberta's Grade 11 Mathematics curriculum, and the ministry's own wording is quoted under each unit on this page — with the official government source linked so you can check it yourself.
What does MapleMind cost?
It's free to start — 5 tutoring chats and a practice quiz every day, no credit card. A Pro subscription ($9.99/month or $49.99/year CAD, 7-day free trial) unlocks unlimited tutoring, practice, and exam simulations.
What if I'm stuck on just one topic?
That's the point of skill-level tutoring: open Mathematics 20-3 in the app, tap the exact skill from the list on this page, and the tutor teaches just that — no wading through lessons you don't need.
Does MapleMind work in French or other languages?
Yes — 14 languages, including French. Both the app and the tutor's explanations switch to the language you choose.
Where can I see the official Alberta curriculum for Mathematics 20-3?
The official source is linked on this page — Alberta's official programs of study. The outline here follows it: every MapleMind skill carries its official outcome code, and the ministry's own wording is quoted under each unit.
Keep exploring
Ready when you are
Pick a skill from this page and see it taught properly — free, in the browser, in under a minute.