Get help with Mathematics 7
Most tutoring makes you sit through material you already know. MapleMind flips that: pick the exact skill that's causing trouble — any of the 50 below — and the tutor teaches just that one, step by step, as many times as it takes. Ask questions in plain words, any time of day, in English, French, or 12 other languages.
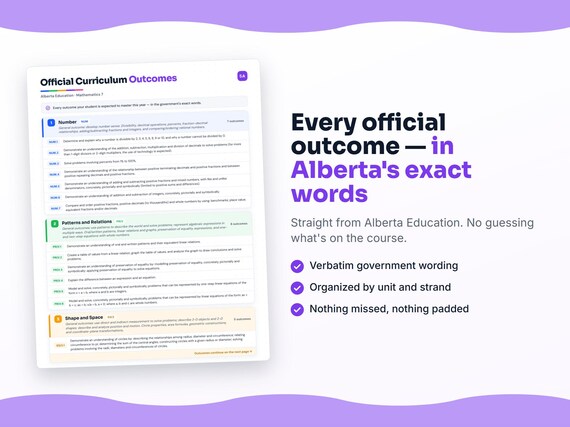
The official Alberta Mathematics 7 curriculum
Alberta defines Mathematics 7 by strands and outcomes. MapleMind teaches the same curriculum reorganized for one-skill-at-a-time tutoring — the table shows exactly where every official strand lands, and the ministry's own wording is quoted under each unit below.
Official source Alberta's official programs of studyRead it on the government site — alberta.ca ↗| Official strand | Outcomes | Where MapleMind teaches it |
|---|---|---|
| Number | 7 | Number |
| Patterns and Relations (Patterns; Variables and Equations) | 7 | Patterns and Relations |
| Shape and Space (Measurement; 3-D Objects and 2-D Shapes; Transformations) | 5 | Shape and Space |
| Statistics and Probability (Data Analysis; Chance and Uncertainty) | 6 | Statistics and Probability |
Every skill below, taught one on one.
 Try the first session free
How MapleMind teaches Mathematics 7 — every unit, lesson, and skill
Every skill below runs as a short session: a plain-words lesson, a worked example, solving it together, then a five-question skill check that earns up to three stars. Guided Mode keeps it teaching instead of answer-handing — turning it off needs a parent's password.
Unit 1NumberOfficial strand · Number
General outcome: develop number sense. Divisibility, decimal operations, percents, fraction-decimal relationships, adding/subtracting fractions and integers, and comparing/ordering rational numbers.
Divisibility Rules
- Testing for divisibility7.N.1 — Determine and explain why a number is divisible by 2, 3, 4, 5, 6, 8, 9 or 10 using quick divisibility tests.
- Why you can never divide by zero7.N.1 — Explain why division by 0 is undefined, connecting to what division means.
Decimal Operations
- Adding and subtracting decimals7.N.2 — Add and subtract decimals to solve problems, aligning place value carefully.
- Multiplying decimals7.N.2 — Multiply decimals, placing the decimal point correctly by counting decimal places.
- Dividing decimals7.N.2 — Divide decimals, including using technology for multi-digit divisors, and solve problems.
Percents from 1% to 100%
- Finding a percent of a number7.N.3 — Find a percent of a number by converting the percent to a decimal or fraction and multiplying.
- Percent problem solving7.N.3 — Solve real-context percent problems (discounts, sales tax, surveys) with percents from 1% to 100%.
Fractions and Decimals
- Terminating decimals and fractions7.N.4 — Convert between positive terminating decimals and their equivalent fractions.
- Repeating decimals and fractions7.N.4 — Convert between positive repeating decimals and their equivalent fractions, and recognize repeating-decimal notation.
Adding and Subtracting Fractions
- Adding and subtracting with like denominators7.N.5 — Add and subtract positive fractions with the same denominator, concretely, pictorially and symbolically.
- Adding and subtracting with unlike denominators7.N.5 — Find a common denominator to add and subtract positive fractions with different denominators.
- Adding and subtracting mixed numbers7.N.5 — Add and subtract positive mixed numbers, limited to positive results.
Adding and Subtracting Integers
- Adding integers7.N.6 — Add integers concretely (chips/number line) and symbolically, including negative results.
- Subtracting integers7.N.6 — Subtract integers by adding the opposite, modelled concretely and on a number line.
Comparing and Ordering Numbers
- Comparing and ordering fractions and decimals7.N.7 — Compare and order positive fractions, positive decimals (to thousandths) and whole numbers using benchmarks, place value and equivalent forms.
- Using benchmarks to compare7.N.7 — Use benchmark values (0, ½, 1) to quickly compare and order a mixed set of numbers without full conversion.
The official wording — 7 outcomes in this unit
- 7.N.1
Determine and explain why a number is divisible by 2, 3, 4, 5, 6, 8, 9 or 10, and why a number cannot be divided by 0.
- 7.N.2
Demonstrate an understanding of the addition, subtraction, multiplication and division of decimals to solve problems (for more than 1-digit divisors or 2-digit multipliers, the use of technology is expected).
- 7.N.3
Solve problems involving percents from 1% to 100%.
- 7.N.4
Demonstrate an understanding of the relationship between positive terminating decimals and positive fractions and between positive repeating decimals and positive fractions.
- 7.N.5
Demonstrate an understanding of adding and subtracting positive fractions and mixed numbers, with like and unlike denominators, concretely, pictorially and symbolically (limited to positive sums and differences).
- 7.N.6
Demonstrate an understanding of addition and subtraction of integers, concretely, pictorially and symbolically.
- 7.N.7
Compare and order positive fractions, positive decimals (to thousandths) and whole numbers by using: benchmarks; place value; equivalent fractions and/or decimals.
Unit 2Patterns and RelationsOfficial strand · Patterns and Relations (Patterns; Variables and Equations)
General outcomes: use patterns to describe the world and solve problems; represent algebraic expressions in multiple ways. Oral/written patterns, linear relations and graphs, preservation of equality, expressions, and one- and two-step equations with whole numbers.
Patterns and Linear Relations
- Oral and written patterns7.PR.1 — Describe a pattern in words (oral/written) and connect it to its equivalent linear relation.
- From pattern description to relation7.PR.1 — Translate a described pattern into its linear relation and verify against given terms.
Graphing Linear Relations
- Building a table of values7.PR.2 — Create a table of values from a linear relation.
- Graphing and analyzing the relation7.PR.2 — Graph the table of values and analyze the graph to draw conclusions and solve problems.
Preservation of Equality
- Modelling preservation of equality7.PR.3 — Model preservation of equality concretely and pictorially — the same change to both sides of a balanced equation keeps it balanced.
- Applying preservation of equality7.PR.3 — Apply preservation of equality symbolically to solve simple equations, doing the same operation to both sides.
Expressions and Equations
- Expression vs. equation7.PR.4 — Explain the difference between an expression (no equals sign) and an equation (has an equals sign, states two things are equal).
- Evaluating expressions7.PR.5 — Evaluate an algebraic expression by substituting given values for the variable(s).
One-Step Equations (x + a = b)
- Modelling one-step equations7.PR.6 — Model a one-step equation of the form x + a = b (a, b integers) concretely and pictorially.
- Solving one-step equations symbolically7.PR.6 — Solve x + a = b symbolically using preservation of equality, and verify the solution.
Equations with Whole-Number Coefficients
- Solving ax = b7.PR.7 — Model and solve equations of the form ax = b (a, b whole numbers).
- Solving x/a = b7.PR.7 — Model and solve equations of the form x/a = b (a ≠ 0, whole numbers).
- Solving ax + b = c7.PR.7 — Model and solve two-step equations of the form ax + b = c with whole-number coefficients.
The official wording — 7 outcomes in this unit
- 7.PR.1
Demonstrate an understanding of oral and written patterns and their equivalent linear relations.
- 7.PR.2
Create a table of values from a linear relation, graph the table of values, and analyze the graph to draw conclusions and solve problems.
- 7.PR.3
Demonstrate an understanding of preservation of equality by: modelling preservation of equality, concretely, pictorially and symbolically; applying preservation of equality to solve equations.
- 7.PR.4
Explain the difference between an expression and an equation.
- 7.PR.5
Evaluate an expression, given the value of the variable(s).
- 7.PR.6
Model and solve, concretely, pictorially and symbolically, problems that can be represented by one-step linear equations of the form x + a = b, where a and b are integers.
- 7.PR.7
Model and solve, concretely, pictorially and symbolically, problems that can be represented by linear equations of the form: ax + b = c; ax = b; x/a = b, a ≠ 0; where a, b and c are whole numbers.
Unit 3Shape and SpaceOfficial strand · Shape and Space (Measurement; 3-D Objects and 2-D Shapes; Transformations)
General outcomes: use direct and indirect measurement to solve problems; describe 3-D objects and 2-D shapes; describe and analyze position and motion. Circle properties, area formulas, geometric constructions, and coordinate-plane transformations.
Circle Properties
- Radius, diameter and circumference7.SS.1 — Describe the relationships among radius, diameter and circumference of a circle.
- Circumference and pi7.SS.1 — Relate circumference to pi (C = πd) and use it to solve for circumference, diameter or radius.
- Central angles and constructing circles7.SS.1 — Determine that the central angles of a circle sum to 360°, and construct circles with a given radius or diameter.
Area of Triangles, Parallelograms and Circles
- Area of triangles7.SS.2 — Develop and apply the formula Area = ½ × base × height for triangles.
- Area of parallelograms7.SS.2 — Develop and apply the formula Area = base × height for parallelograms.
- Area of circles7.SS.2 — Develop and apply the formula Area = πr² for circles, and solve problems.
Geometric Constructions
- Perpendicular and parallel line segments7.SS.3 — Construct perpendicular and parallel line segments using geometry tools.
- Perpendicular and angle bisectors7.SS.3 — Construct perpendicular bisectors of segments and bisectors of angles.
Plotting Points in Four Quadrants
- Identifying and plotting integer coordinates7.SS.4 — Identify and plot points in all four quadrants of a Cartesian plane using integer ordered pairs.
Transformations in Four Quadrants
- Translations, rotations and reflections7.SS.5 — Perform and describe translations, rotations and reflections of a 2-D shape in all four quadrants (integer-coordinate vertices).
- Describing a transformation from coordinates7.SS.5 — Given a shape and its image, describe which transformation(s) produced it.
The official wording — 5 outcomes in this unit
- 7.SS.1
Demonstrate an understanding of circles by: describing the relationships among radius, diameter and circumference; relating circumference to pi; determining the sum of the central angles; constructing circles with a given radius or diameter; solving problems involving the radii, diameters and circumferences of circles.
- 7.SS.2
Develop and apply a formula for determining the area of: triangles; parallelograms; circles.
- 7.SS.3
Perform geometric constructions, including: perpendicular line segments; parallel line segments; perpendicular bisectors; angle bisectors.
- 7.SS.4
Identify and plot points in the four quadrants of a Cartesian plane, using integral ordered pairs.
- 7.SS.5
Perform and describe transformations (translations, rotations or reflections) of a 2-D shape in all four quadrants of a Cartesian plane (limited to integral number vertices).
Unit 4Statistics and ProbabilityOfficial strand · Statistics and Probability (Data Analysis; Chance and Uncertainty)
General outcomes: collect, display and analyze data to solve problems; use experimental or theoretical probabilities to solve problems. Central tendency and range, outliers, circle graphs, and the probability of independent events.
Central Tendency and Range
- Mean, median and mode7.SP.1 — Determine the mean, median and mode of a data set.
- Range and choosing the best measure7.SP.1 — Determine the range of a data set and decide which measure of central tendency best represents it.
Outliers
- How outliers affect mean, median and mode7.SP.2 — Determine the effect on the mean, median and mode when an outlier is included in a data set.
Circle Graphs
- Constructing circle graphs7.SP.3 — Construct and label a circle graph from a data set, converting values to appropriate sector angles.
- Interpreting circle graphs7.SP.3 — Interpret a circle graph to solve problems and answer questions about the data.
Expressing Probability
- Probability as a ratio, fraction and percent7.SP.4 — Express a probability as a ratio, fraction and percent, and convert among the three forms.
Sample Space for Two Independent Events
- Identifying the sample space7.SP.5 — Identify the sample space for two independent events (36 or fewer combined outcomes) using a table or tree diagram.
- Organizing outcomes with tables and tree diagrams7.SP.5 — Use a table, tree diagram or other graphic organizer to systematically list all outcomes of two independent events.
Experimental vs. Theoretical Probability
- Theoretical probability of two independent events7.SP.6 — Determine the theoretical probability of two independent events using a tree diagram, table or other graphic organizer.
- Comparing to experimental probability7.SP.6 — Conduct a probability experiment for two independent events and compare the experimental results to the theoretical probability.
The official wording — 6 outcomes in this unit
- 7.SP.1
Demonstrate an understanding of central tendency and range by: determining the measures of central tendency (mean, median, mode) and range; determining the most appropriate measures of central tendency to report findings.
- 7.SP.2
Determine the effect on the mean, median and mode when an outlier is included in a data set.
- 7.SP.3
Construct, label and interpret circle graphs to solve problems.
- 7.SP.4
Express probabilities as ratios, fractions and percents.
- 7.SP.5
Identify the sample space (where the combined sample space has 36 or fewer elements) for a probability experiment involving two independent events.
- 7.SP.6
Conduct a probability experiment to compare the theoretical probability (determined using a tree diagram, table or other graphic organizer) and experimental probability of two independent events.
Printable workbook · A keepsake of the year
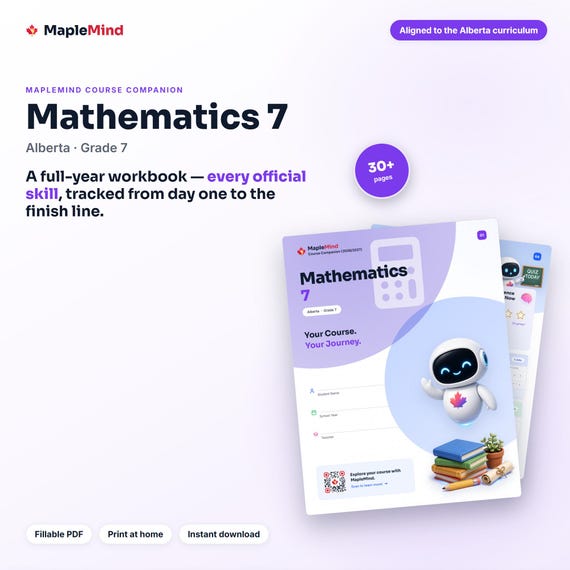
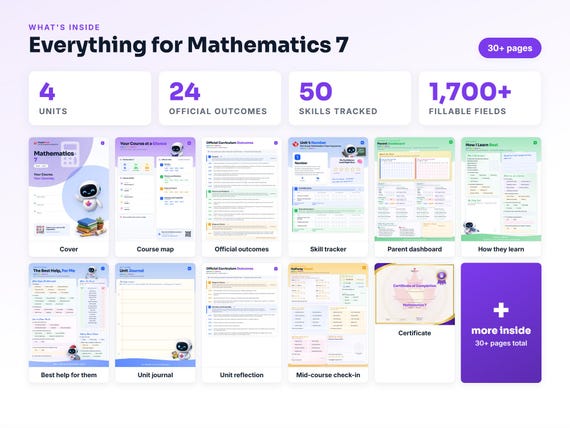
A Mathematics 7 workbook worth keeping
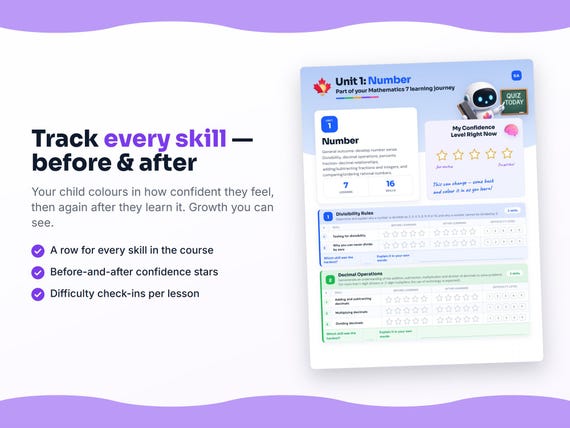
Built from the same official curriculum as this page. Before and after each skill above, your student colours in how sure they feel — so the two of you can see, on one page, what's clicking and what needs another look. It's a quiet way to follow how the year is really going.
By June it's full of their own handwriting: units worked through, confidence grown, a mid-year check-in, notes from parent-teacher night, and a certificate at the end. Less a worksheet, more a record of the year worth keeping on the shelf.
Instant download · see every page, reviews and the full description · five or more workbooks are $2.99 each
What it looks like in the app
Common questions
Can MapleMind help me with Mathematics 7?
Yes. MapleMind's AI tutor covers all 50 skills in Alberta's Mathematics 7 — you pick the exact skill, and the tutor teaches it step by step: a short lesson, a worked example, solving together, then a skill check to show it stuck.
Is MapleMind aligned to Alberta's official curriculum?
Yes. Every skill in this course maps to an official outcome code from Alberta's Grade 7 Mathematics curriculum, and the ministry's own wording is quoted under each unit on this page — with the official government source linked so you can check it yourself.
What does MapleMind cost?
It's free to start — 5 tutoring chats and a practice quiz every day, no credit card. A Pro subscription ($9.99/month or $49.99/year CAD, 7-day free trial) unlocks unlimited tutoring, practice, and exam simulations.
What if I'm stuck on just one topic?
That's the point of skill-level tutoring: open Mathematics 7 in the app, tap the exact skill from the list on this page, and the tutor teaches just that — no wading through lessons you don't need.
Does MapleMind work in French or other languages?
Yes — 14 languages, including French. Both the app and the tutor's explanations switch to the language you choose.
Where can I see the official Alberta curriculum for Mathematics 7?
The official source is linked on this page — Alberta's official programs of study. The outline here follows it: every MapleMind skill carries its official outcome code, and the ministry's own wording is quoted under each unit.
Keep exploring
Ready when you are
Pick a skill from this page and see it taught properly — free, in the browser, in under a minute.