Get help with Mathematics, Grade 7
Most tutoring makes you sit through material you already know. MapleMind flips that: pick the exact skill that's causing trouble — any of the 53 below — and the tutor teaches just that one, step by step, as many times as it takes. Ask questions in plain words, any time of day, in English, French, or 12 other languages.
The official Ontario Mathematics, Grade 7 curriculum
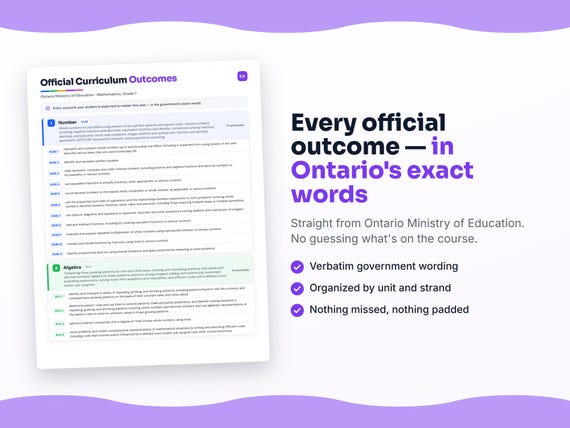
Ontario defines Mathematics, Grade 7 by strands and outcomes. MapleMind teaches the same curriculum reorganized for one-skill-at-a-time tutoring — the table shows exactly where every official strand lands, and the ministry's own wording is quoted under each unit below.
Official source Ontario's official mathematics curriculumRead it on the government site — dcp.edu.gov.on.ca ↗| Official strand | Outcomes | Where MapleMind teaches it |
|---|---|---|
| Strand B | 18 | Number |
| Strand C | 10 | Algebra |
| Strand D | 8 | Data |
| Strand E | 11 | Spatial Sense |
| Strand F | 6 | Financial Literacy |
Ontario also defines Strand A — Social-Emotional Learning Skills — which the ministry teaches through every other strand rather than as its own unit, so it doesn't get a row of its own.
Every skill below, taught one on one.
 Try the first session free
How MapleMind teaches Mathematics, Grade 7 — every unit, lesson, and skill
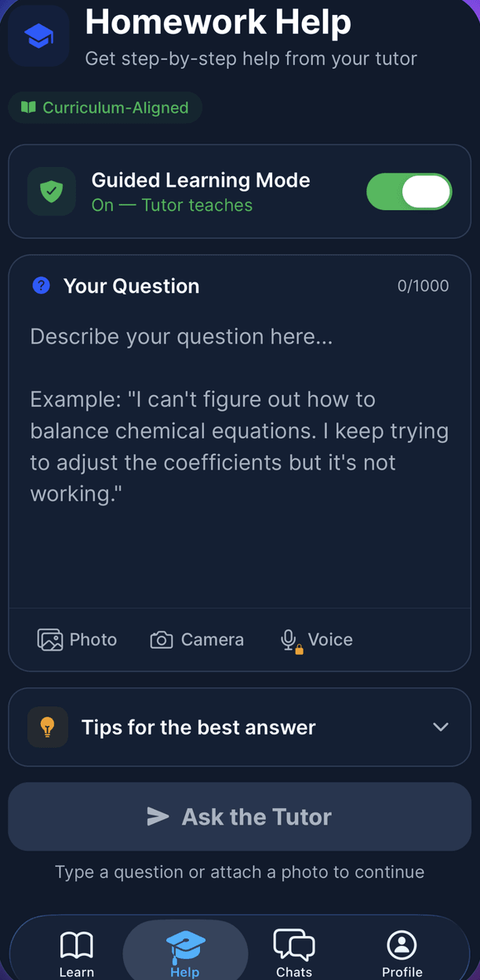
Every skill below runs as a short session: a plain-words lesson, a worked example, solving it together, then a five-question skill check that earns up to three stars. Guided Mode keeps it teaching instead of answer-handing — turning it off needs a parent's password.
Unit 1NumberOfficial strand · Strand B
Whole numbers to one billion using powers of ten; perfect squares and square roots; rational numbers including negative fractions and decimals; equivalent fractions and density; conversions among fractions, decimals, and percents; multi-step problems; integer addition and subtraction; fraction and decimal operations; GCF/LCM; exponential notation; and proportional reasoning.
Whole Numbers to One Billion
- Representing and comparing whole numbers to one billion using powers of tenB1.1 — Represent and compare whole numbers up to one billion, including in expanded form using powers of ten, and describe various ways they are used in everyday life.
Perfect Squares and Square Roots
- Identifying and representing perfect squaresB1.2a — Identify and represent perfect squares.
- Determining square roots of perfect squaresB1.2b — Determine the square roots of perfect squares, in various contexts.
Rational Numbers
- Reading, representing, comparing, and ordering rational numbers, including negativesB1.3 — Read, represent, compare, and order rational numbers, including positive and negative fractions and decimal numbers to thousandths, in various contexts.
Simplifying Fractions and Generating Numbers Between Quantities
- Using equivalent fractions to simplify fractionsB1.4 — Use equivalent fractions to simplify fractions, when appropriate, in various contexts.
- Generating fractions and decimals between any two quantitiesB1.5 — Generate fractions and decimal numbers between any two quantities.
Rounding and Converting Fractions, Decimals, and Percents
- Rounding decimals to the nearest tenth, hundredth, or whole numberB1.6 — Round decimal numbers to the nearest tenth, hundredth, or whole number, as applicable, in various contexts.
- Converting between fractions, decimals, and percentsB1.7 — Convert between fractions, decimal numbers, and percents, in various contexts.
Order of Operations and Multi-Step Problems
- Using order of operations to solve multi-step problemsB2.1 — Use the properties and order of operations, and the relationships between operations, to solve multi-step problems involving whole numbers, decimals, fractions, ratios, rates, and percents.
- Recalling commonly used percent, fraction, and decimal equivalentsB2.2 — Understand and recall commonly used percents, fractions, and decimal equivalents.
- Mental math: increasing and decreasing by a percentB2.3 — Use mental math strategies to increase and decrease a whole number by 1%, 5%, 10%, 25%, 50%, and 100%, explaining the strategies used.
Adding and Subtracting Integers
- Representing and solving addition and subtraction of integersB2.4 — Use objects, diagrams, and equations to represent, describe, and solve situations involving addition and subtraction of integers.
Adding and Subtracting Fractions, GCF, and LCM
- Adding and subtracting fractions, including by creating equivalent fractionsB2.5 — Add and subtract fractions, including by creating equivalent fractions, in various contexts.
- Determining the greatest common factor and lowest common multipleB2.6 — Determine the greatest common factor for a variety of whole numbers up to 144 and the lowest common multiple for two and three whole numbers.
Exponential Notation
- Expressing repeated multiplication using exponential notationB2.7 — Evaluate and express repeated multiplication of whole numbers using exponential notation, in various contexts.
Multiplying and Dividing Fractions and Decimals
- Multiplying and dividing fractions by fractionsB2.8 — Multiply and divide fractions by fractions, using tools in various contexts.
- Multiplying and dividing decimals by decimalsB2.9 — Multiply and divide decimal numbers by decimal numbers, in various contexts.
Proportional Reasoning
- Identifying proportional situations and applying proportional reasoningB2.10 — Identify proportional and non-proportional situations and apply proportional reasoning to solve problems.
The official wording — 18 outcomes in this unit
- B1.1
represent and compare whole numbers up to and including one billion, including in expanded form using powers of ten, and describe various ways they are used in everyday life
- B1.2a
identify and represent perfect squares
- B1.2b
and determine their square roots, in various contexts
- B1.3
read, represent, compare, and order rational numbers, including positive and negative fractions and decimal numbers to thousandths, in various contexts
- B1.4
use equivalent fractions to simplify fractions, when appropriate, in various contexts
- B1.5
generate fractions and decimal numbers between any two quantities
- B1.6
round decimal numbers to the nearest tenth, hundredth, or whole number, as applicable, in various contexts
- B1.7
convert between fractions, decimal numbers, and percents, in various contexts
- B2.1
use the properties and order of operations, and the relationships between operations, to solve problems involving whole numbers, decimal numbers, fractions, ratios, rates, and percents, including those requiring multiple steps or multiple operations
- B2.2
understand and recall commonly used percents, fractions, and decimal equivalents
- B2.3
use mental math strategies to increase and decrease a whole number by 1%, 5%, 10%, 25%, 50%, and 100%, and explain the strategies used
- B2.4
use objects, diagrams, and equations to represent, describe, and solve situations involving addition and subtraction of integers
- B2.5
add and subtract fractions, including by creating equivalent fractions, in various contexts
- B2.6
determine the greatest common factor for a variety of whole numbers up to 144 and the lowest common multiple for two and three whole numbers
- B2.7
evaluate and express repeated multiplication of whole numbers using exponential notation, in various contexts
- B2.8
multiply and divide fractions by fractions, using tools in various contexts
- B2.9
multiply and divide decimal numbers by decimal numbers, in various contexts
- B2.10
identify proportional and non-proportional situations and apply proportional reasoning to solve problems
Unit 2AlgebraOfficial strand · Strand C
Comparing linear growing patterns by rate and initial value; creating and translating patterns with whole and decimal numbers; algebra for linear patterns; patterns among integers; adding and subtracting monomials; evaluating expressions; solving multi-term equations and inequalities; and efficient code with a defined count and/or sub-program.
Comparing Linear Growing Patterns
- Comparing patterns, including linear growing patterns by rate and initial valueC1.1 — Identify and compare a variety of repeating, growing, and shrinking patterns, including patterns found in real-life contexts, and compare linear growing patterns on the basis of their constant rates and initial values.
- Creating and translating patterns with whole and decimal numbers, using algebra for linear patternsC1.2 — Create and translate repeating, growing, and shrinking patterns involving whole numbers and decimal numbers using various representations, including algebraic expressions and equations for linear growing patterns.
Pattern Rules and Patterns Among Integers
- Determining pattern rules and solving for unknowns in linear growing patternsC1.3 — Determine pattern rules and use them to extend patterns, make and justify predictions, and identify missing elements in patterns involving whole numbers and decimal numbers, and use algebraic representations of pattern rules to solve for unknown values in linear growing patterns.
- Creating patterns to show relationships among integersC1.4 — Create and describe patterns to illustrate relationships among integers.
Monomials, Expressions, Equations, and Inequalities
- Adding and subtracting monomials with a degree of 1C2.1 — Add and subtract monomials with a degree of 1 that involve whole numbers, using tools.
- Evaluating algebraic expressions with whole and decimal numbersC2.2 — Evaluate algebraic expressions that involve whole numbers and decimal numbers.
- Solving multi-term equations with whole and decimal numbersC2.3 — Solve equations that involve multiple terms, whole numbers, and decimal numbers in various contexts, and verify solutions.
- Solving and graphing multi-term inequalitiesC2.4 — Solve inequalities that involve multiple terms and whole numbers, and verify and graph the solutions.
Coding with a Defined Count and Sub-Programs
- Writing and running efficient code involving a defined count and/or sub-programC3.1 — Solve problems and create computational representations of mathematical situations by writing and executing efficient code that involves events influenced by a defined count and/or sub-program and other control structures.
- Reading and altering code involving a defined count and/or sub-programC3.2 — Read and alter existing code that involves events influenced by a defined count and/or sub-program and other control structures, and describe how changes to the code affect the outcomes and the efficiency of the code.
The official wording — 10 outcomes in this unit
- C1.1
identify and compare a variety of repeating, growing, and shrinking patterns, including patterns found in real-life contexts, and compare linear growing patterns on the basis of their constant rates and initial values
- C1.2
create and translate repeating, growing, and shrinking patterns involving whole numbers and decimal numbers using various representations, including algebraic expressions and equations for linear growing patterns
- C1.3
determine pattern rules and use them to extend patterns, make and justify predictions, and identify missing elements in repeating, growing, and shrinking patterns involving whole numbers and decimal numbers, and use algebraic representations of the pattern rules to solve for unknown values in linear growing patterns
- C1.4
create and describe patterns to illustrate relationships among integers
- C2.1
add and subtract monomials with a degree of 1 that involve whole numbers, using tools
- C2.2
evaluate algebraic expressions that involve whole numbers and decimal numbers
- C2.3
solve equations that involve multiple terms, whole numbers, and decimal numbers in various contexts, and verify solutions
- C2.4
solve inequalities that involve multiple terms and whole numbers, and verify and graph the solutions
- C3.1
solve problems and create computational representations of mathematical situations by writing and executing efficient code, including code that involves events influenced by a defined count and/or sub-program and other control structures
- C3.2
read and alter existing code, including code that involves events influenced by a defined count and/or sub-program and other control structures, and describe how changes to the code affect the outcomes and the efficiency of the code
Unit 3DataOfficial strand · Strand D
Percentages for distribution; collecting and organizing data using percentages; circle graphs and infographics; the impact of adding or removing data on central tendency; analysing circle and misleading graphs; and independent versus dependent events.
Percentages for Data Distribution
- Explaining why percentages represent data distributionD1.1 — Explain why percentages are used to represent the distribution of a variable for a population or sample in large sets of data, and provide examples.
- Collecting qualitative and quantitative data, organizing using percentagesD1.2 — Collect qualitative data and discrete and continuous quantitative data to answer questions of interest, and organize the sets of data as appropriate, including using percentages.
Circle Graphs and Infographics
- Selecting and justifying a graph type, including circle graphsD1.3 — Select from a variety of graphs, including circle graphs, the type best suited to represent data; display data with proper sources, titles, labels, and scales; and justify the choice.
- Creating an infographic using tables and circle graphsD1.4 — Create an infographic about a data set, representing the data in tables and circle graphs, and incorporating other relevant information to tell a story about the data.
Impact on Central Tendency and Analysing Data
- Determining the impact of adding or removing data on central tendencyD1.5 — Determine the impact of adding or removing data from a data set on a measure of central tendency, and describe how these changes alter the shape and distribution of the data.
- Analysing data in circle graphs and misleading graphsD1.6 — Analyse data sets presented in circle graphs and misleading graphs by asking and answering questions, challenging preconceived notions, drawing conclusions, and making convincing arguments and informed decisions.
Independent and Dependent Events
- Describing the difference between independent and dependent eventsD2.1 — Describe the difference between independent and dependent events, and explain how their probabilities differ, providing examples.
- Comparing probabilities of two independent events and of two dependent eventsD2.2 — Determine and compare the theoretical and experimental probabilities of two independent events happening and of two dependent events happening.
The official wording — 8 outcomes in this unit
- D1.1
explain why percentages are used to represent the distribution of a variable for a population or sample in large sets of data, and provide examples
- D1.2
collect qualitative data and discrete and continuous quantitative data to answer questions of interest, and organize the sets of data as appropriate, including using percentages
- D1.3
select from among a variety of graphs, including circle graphs, the type of graph best suited to represent various sets of data; display the data in the graphs with proper sources, titles, and labels, and appropriate scales; and justify their choice of graphs
- D1.4
create an infographic about a data set, representing the data in appropriate ways, including in tables and circle graphs, and incorporating any other relevant information that helps to tell a story about the data
- D1.5
determine the impact of adding or removing data from a data set on a measure of central tendency, and describe how these changes alter the shape and distribution of the data
- D1.6
analyse different sets of data presented in various ways, including in circle graphs and in misleading graphs, by asking and answering questions about the data, challenging preconceived notions, and drawing conclusions, then make convincing arguments and informed decisions
- D2.1
describe the difference between independent and dependent events, and explain how their probabilities differ, providing examples
- D2.2
determine and compare the theoretical and experimental probabilities of two independent events happening and of two dependent events happening
Unit 4Spatial SenseOfficial strand · Strand E
Classifying cylinders, pyramids, and prisms; top, front, side, and perspective views with scales; dilations and similarity; transformations on the Cartesian plane; volume vs. capacity; metric conversions for perimeter, area, and volume; circumference and area of circles; constructing circles; cylinder nets and surface area; and volume of prisms and cylinders.
Classifying Cylinders, Pyramids, and Prisms
- Describing and classifying cylinders, pyramids, and prisms by geometric propertiesE1.1 — Describe and classify cylinders, pyramids, and prisms according to their geometric properties, including plane and rotational symmetry.
Views with Scales, Including Perspective
- Drawing top, front, side, and perspective views using scalesE1.2 — Draw top, front, and side views, as well as perspective views, of objects and physical spaces, using appropriate scales.
Dilations and Transformations on the Cartesian Plane
- Performing dilations and describing similarityE1.3 — Perform dilations and describe the similarity between the image and the original shape.
- Performing translations, reflections, and rotations on a Cartesian planeE1.4 — Describe and perform translations, reflections, and rotations on a Cartesian plane, and predict the results of these transformations.
Volume, Capacity, and Metric Conversions
- Describing volume and capacity and relating millilitres to cubic centimetresE2.1 — Describe the differences and similarities between volume and capacity, and apply the relationship between millilitres (mL) and cubic centimetres (cm3) to solve problems.
- Solving perimeter, area, and volume problems requiring metric conversionsE2.2 — Solve problems involving perimeter, area, and volume that require converting from one metric unit of measurement to another.
Circles: Circumference, Area, and Construction
- Using radius, diameter, and circumference relationships to explain the circumference formulaE2.3 — Use the relationships between the radius, diameter, and circumference of a circle to explain the formula for finding the circumference and to solve related problems.
- Constructing circles given radius, diameter, or circumferenceE2.4 — Construct circles when given the radius, diameter, or circumference.
- Using radius, diameter, and area relationships to explain the area-of-a-circle formulaE2.5 — Show the relationships between the radius, diameter, and area of a circle, and use these relationships to explain the formula for measuring the area of a circle and to solve related problems.
Cylinder Nets and the Volume of Prisms and Cylinders
- Representing cylinders as nets and determining their surface areaE2.6 — Represent cylinders as nets and determine their surface area by adding the areas of their parts.
- Determining the volume of a prism or cylinder from base area and heightE2.7 — Show that the volume of a prism or cylinder can be determined by multiplying the area of its base by its height, and apply this relationship to find the area of the base, volume, and height of prisms and cylinders when given two of the three measurements.
The official wording — 11 outcomes in this unit
- E1.1
describe and classify cylinders, pyramids, and prisms according to their geometric properties, including plane and rotational symmetry
- E1.2
draw top, front, and side views, as well as perspective views, of objects and physical spaces, using appropriate scales
- E1.3
perform dilations and describe the similarity between the image and the original shape
- E1.4
describe and perform translations, reflections, and rotations on a Cartesian plane, and predict the results of these transformations
- E2.1
describe the differences and similarities between volume and capacity, and apply the relationship between millilitres (mL) and cubic centimetres (cm3) to solve problems
- E2.2
solve problems involving perimeter, area, and volume that require converting from one metric unit of measurement to another
- E2.3
use the relationships between the radius, diameter, and circumference of a circle to explain the formula for finding the circumference and to solve related problems
- E2.4
construct circles when given the radius, diameter, or circumference
- E2.5
show the relationships between the radius, diameter, and area of a circle, and use these relationships to explain the formula for measuring the area of a circle and to solve related problems
- E2.6
represent cylinders as nets and determine their surface area by adding the areas of their parts
- E2.7
show that the volume of a prism or cylinder can be determined by multiplying the area of its base by its height, and apply this relationship to find the area of the base, volume, and height of prisms and cylinders when given two of the three measurements
Unit 5Financial LiteracyOfficial strand · Strand F
Exchange rates and currency conversion; reliable sources for financial planning; longer-term sample budgets; factors influencing financial decisions; interest rates over time; and comparing institutions for the best financial option.
Exchange Rates and Currency Conversion
- Identifying and comparing exchange rates and converting foreign currenciesF1.1 — Identify and compare exchange rates, and convert foreign currencies to Canadian dollars and vice versa.
Reliable Sources and Longer-Term Budgets
- Identifying reliable sources of information for financial planningF1.2 — Identify and describe various reliable sources of information that can help with planning for and reaching a financial goal.
- Creating, tracking, and adjusting sample budgets for longer-term goalsF1.3 — Create, track, and adjust sample budgets designed to meet longer-term financial goals for various scenarios.
Factors in Financial Decisions and Interest Over Time
- Identifying societal and personal factors influencing financial decisionsF1.4 — Identify various societal and personal factors that may influence financial decision making, and describe the effects that each might have.
- Explaining how interest rates impact savings, investments, and borrowing over timeF1.5 — Explain how interest rates can impact savings, investments, and the cost of borrowing to pay for goods and services over time.
Comparing Financial Institutions
- Comparing interest rates and fees to determine the best financial optionF1.6 — Compare interest rates and fees for different accounts and loans offered by various financial institutions, and determine the best option for different scenarios.
The official wording — 6 outcomes in this unit
- F1.1
identify and compare exchange rates, and convert foreign currencies to Canadian dollars and vice versa
- F1.2
identify and describe various reliable sources of information that can help with planning for and reaching a financial goal
- F1.3
create, track, and adjust sample budgets designed to meet longer-term financial goals for various scenarios
- F1.4
identify various societal and personal factors that may influence financial decision making, and describe the effects that each might have
- F1.5
explain how interest rates can impact savings, investments, and the cost of borrowing to pay for goods and services over time
- F1.6
compare interest rates and fees for different accounts and loans offered by various financial institutions, and determine the best option for different scenarios
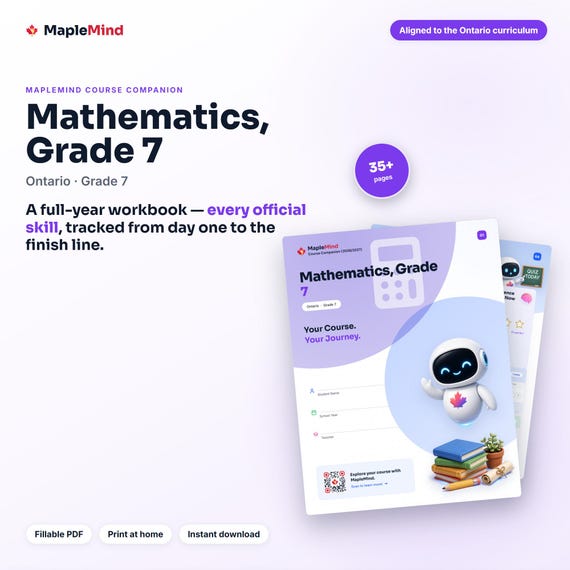
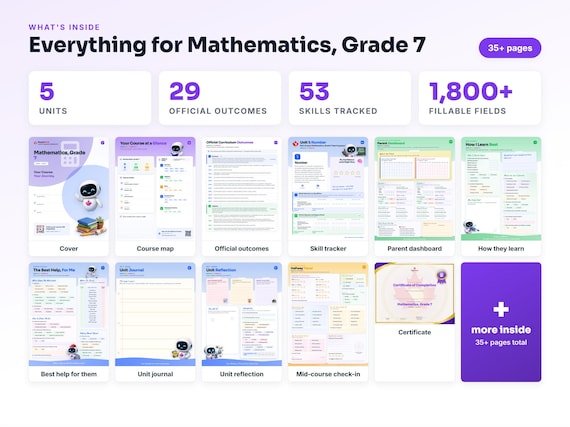

Printable workbook · A keepsake of the year
A Mathematics, Grade 7 workbook worth keeping
Built from the same official curriculum as this page. Before and after each skill above, your student colours in how sure they feel — so the two of you can see, on one page, what's clicking and what needs another look. It's a quiet way to follow how the year is really going.
By June it's full of their own handwriting: units worked through, confidence grown, a mid-year check-in, notes from parent-teacher night, and a certificate at the end. Less a worksheet, more a record of the year worth keeping on the shelf.
Instant download · see every page, reviews and the full description · five or more workbooks are $2.99 each
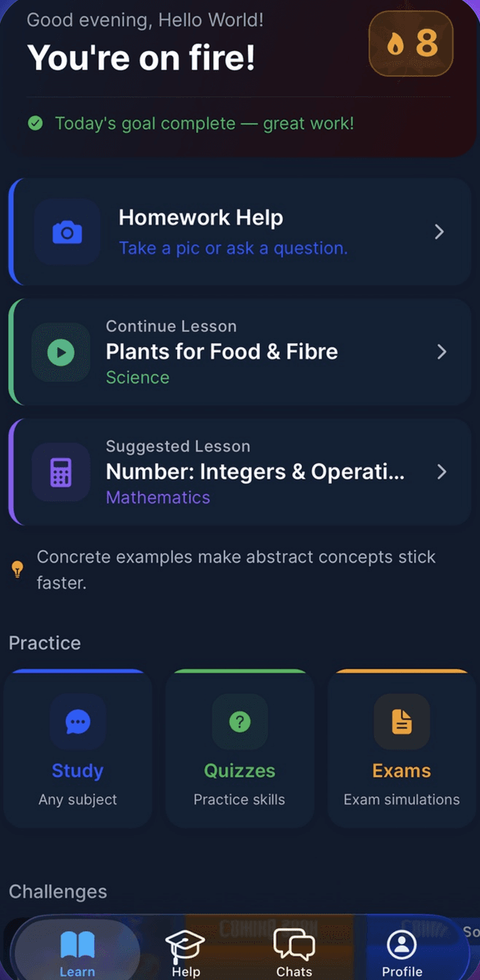
What it looks like in the app
Common questions
Can MapleMind help me with Mathematics, Grade 7?
Yes. MapleMind's AI tutor covers all 53 skills in Ontario's Mathematics, Grade 7 — you pick the exact skill, and the tutor teaches it step by step: a short lesson, a worked example, solving together, then a skill check to show it stuck.
Is MapleMind aligned to Ontario's official curriculum?
Yes. Every skill in this course maps to an official outcome code from Ontario's Grade 7 Mathematics curriculum, and the ministry's own wording is quoted under each unit on this page — with the official government source linked so you can check it yourself.
What does MapleMind cost?
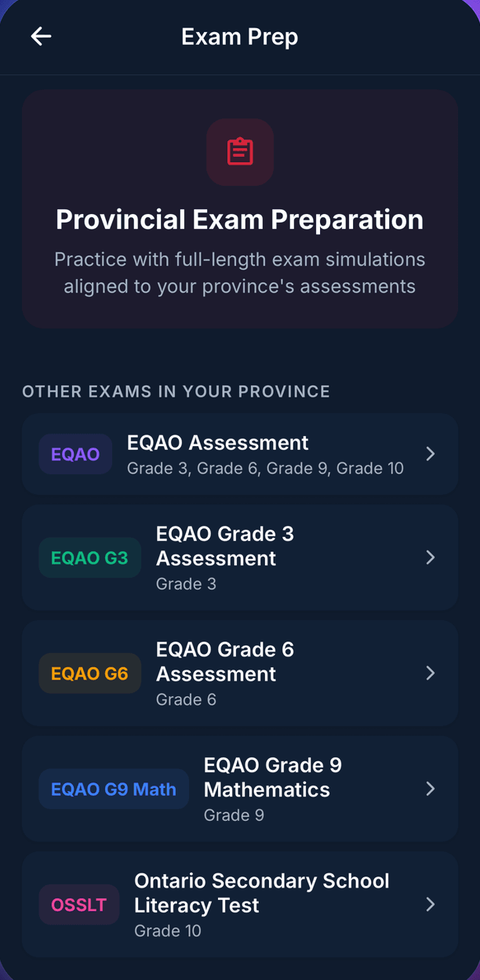
It's free to start — 5 tutoring chats and a practice quiz every day, no credit card. A Pro subscription ($9.99/month or $49.99/year CAD, 7-day free trial) unlocks unlimited tutoring, practice, and exam simulations.
What if I'm stuck on just one topic?
That's the point of skill-level tutoring: open Mathematics, Grade 7 in the app, tap the exact skill from the list on this page, and the tutor teaches just that — no wading through lessons you don't need.
Does MapleMind work in French or other languages?
Yes — 14 languages, including French. Both the app and the tutor's explanations switch to the language you choose.
Where can I see the official Ontario curriculum for Mathematics, Grade 7?
The official source is linked on this page — Ontario's official mathematics curriculum. The outline here follows it: every MapleMind skill carries its official outcome code, and the ministry's own wording is quoted under each unit.
Keep exploring
Ready when you are
Pick a skill from this page and see it taught properly — free, in the browser, in under a minute.