Get help with Mathematics 7
Most tutoring makes you sit through material you already know. MapleMind flips that: pick the exact skill that's causing trouble — any of the 25 below — and the tutor teaches just that one, step by step, as many times as it takes. Ask questions in plain words, any time of day, in English, French, or 12 other languages.
The official British Columbia Mathematics 7 curriculum
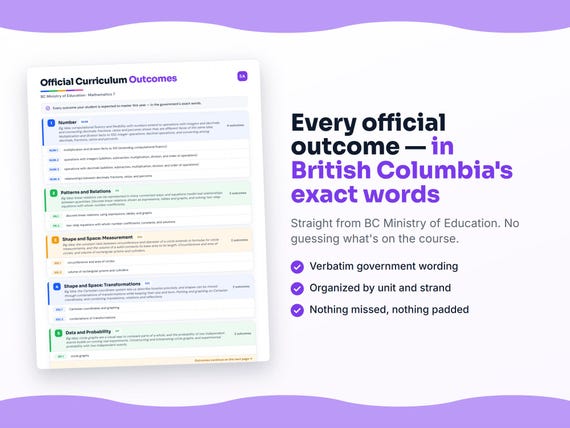
British Columbia defines Mathematics 7 by strands and outcomes. MapleMind teaches the same curriculum reorganized for one-skill-at-a-time tutoring — the table shows exactly where every official strand lands, and the ministry's own wording is quoted under each unit below.
Official source BC's official mathematics curriculumRead it on the government site — curriculum.gov.bc.ca ↗| Official strand | Outcomes | Where MapleMind teaches it |
|---|---|---|
| Number | 4 | Number |
| Patterns and Relations | 2 | Patterns and Relations |
| Shape and Space (Measurement) | 2 | Shape and Space: Measurement |
| Shape and Space (Transformations) | 2 | Shape and Space: Transformations |
| Data and Probability | 2 | Data and Probability |
| Financial Literacy | 1 | Financial Literacy |
Every skill below, taught one on one.
 Try the first session free
How MapleMind teaches Mathematics 7 — every unit, lesson, and skill
Every skill below runs as a short session: a plain-words lesson, a worked example, solving it together, then a five-question skill check that earns up to three stars. Guided Mode keeps it teaching instead of answer-handing — turning it off needs a parent's password.
Unit 1NumberOfficial strand · Number
Big Idea: computational fluency and flexibility with numbers extend to operations with integers and decimals, and connecting decimals, fractions, ratios and percents shows they are different faces of the same idea. Multiplication and division facts to 100, integer operations, decimal operations, and converting among decimals, fractions, ratios and percents.
Multiplication and Division Facts to 100
- Fast, reliable facts to 1007.C.1 — Recall multiplication and division facts up to 100 quickly and accurately, using strategies (doubling, near facts, fact families) to fill any gaps.
Operations with Integers
- Adding and subtracting integers7.C.2 — Add and subtract positive and negative integers using a number line or integer chips, and symbolically.
- Multiplying and dividing integers7.C.2 — Multiply and divide integers, using the sign rules (same signs give a positive result, different signs give a negative result).
- Order of operations with integers7.C.2 — Apply the correct order of operations (brackets, exponents, multiplication/division, addition/subtraction) to expressions mixing all four integer operations.
Operations with Decimals
- Adding and subtracting decimals7.C.3 — Add and subtract decimals by aligning place value, including decimals with different numbers of decimal places.
- Multiplying and dividing decimals7.C.3 — Multiply and divide decimals, tracking the decimal point correctly through each operation.
- Order of operations with decimals7.C.3 — Apply the order of operations to multi-step expressions that combine decimal addition, subtraction, multiplication and division.
Decimals, Fractions, Ratios and Percents
- Moving between decimals, fractions, ratios and percents7.C.4 — Convert a number among its decimal, fraction, ratio and percent forms, recognizing they all describe the same quantity.
- Choosing the most useful form7.C.4 — Decide which form (decimal, fraction, ratio or percent) makes a given real-world problem easiest to solve, and convert to it.
The official wording — 4 outcomes in this unit
- 7.C.1
multiplication and division facts to 100 (extending computational fluency)
- 7.C.2
operations with integers (addition, subtraction, multiplication, division, and order of operations)
- 7.C.3
operations with decimals (addition, subtraction, multiplication, division, and order of operations)
- 7.C.4
relationships between decimals, fractions, ratios, and percents
Unit 2Patterns and RelationsOfficial strand · Patterns and Relations
Big Idea: linear relations can be represented in many connected ways, and equations model real relationships between quantities. Discrete linear relations shown as expressions, tables and graphs, and solving two-step equations with whole-number coefficients.
Linear Relations: Expressions, Tables, and Graphs
- From expression to table of values7.C.5 — Generate a table of values for a discrete linear relation by substituting whole-number inputs into an expression.
- From table to graph7.C.5 — Plot the ordered pairs from a table of values for a discrete linear relation and describe the pattern the points make.
Two-Step Equations
- Solving two-step equations7.C.6 — Solve a two-step equation with whole-number coefficients, constants and solutions (like 3x + 4 = 19) by undoing operations in reverse order.
- Verifying the solution7.C.6 — Verify a two-step equation solution by substituting it back into the original equation and checking both sides match.
The official wording — 2 outcomes in this unit
- 7.C.5
discrete linear relations, using expressions, tables, and graphs
- 7.C.6
two-step equations with whole-number coefficients, constants, and solutions
Unit 3Shape and Space: MeasurementOfficial strand · Shape and Space (Measurement)
Big Idea: the constant ratio between circumference and diameter of a circle extends to formulas for circle measurements, and the volume of a solid connects its base area to its length. Circumference and area of circles, and volume of rectangular prisms and cylinders.
Circumference and Area of Circles
- Finding circumference7.C.7 — Find the circumference of a circle from its radius or diameter using C = πd (or C = 2πr).
- Finding area of a circle7.C.7 — Find the area of a circle from its radius using A = πr², converting from diameter when needed.
Volume of Rectangular Prisms and Cylinders
- Volume of a rectangular prism7.C.8 — Find the volume of a rectangular prism using Volume = length × width × height, or base area × height.
- Volume of a cylinder7.C.8 — Find the volume of a cylinder using Volume = base area (πr²) × height, connecting it to the rectangular-prism idea.
The official wording — 2 outcomes in this unit
- 7.C.7
circumference and area of circles
- 7.C.8
volume of rectangular prisms and cylinders
Unit 4Shape and Space: TransformationsOfficial strand · Shape and Space (Transformations)
Big Idea: the Cartesian coordinate system lets us describe location precisely, and shapes can be moved through combinations of transformations while keeping their size and form. Plotting and graphing on Cartesian coordinates, and combining translations, rotations and reflections.
Cartesian Coordinates and Graphing
- Plotting and reading coordinates7.C.9 — Plot and identify points anywhere on the Cartesian plane, including all four quadrants, and use coordinates to graph a relation.
Combining Transformations
- Combining two transformations7.C.10 — Apply two transformations (translation, rotation, reflection) to a shape in sequence and describe the resulting image.
- Describing a combined transformation7.C.10 — Given a shape and its final image after two transformations, describe which combination of moves produced it.
The official wording — 2 outcomes in this unit
- 7.C.9
Cartesian coordinates and graphing
- 7.C.10
combinations of transformations
Unit 5Data and ProbabilityOfficial strand · Data and Probability
Big Idea: circle graphs are a visual way to compare parts of a whole, and the probability of two independent events builds on running real experiments. Constructing and interpreting circle graphs, and experimental probability with two independent events.
Circle Graphs
- Constructing a circle graph7.C.11 — Construct a circle graph from a data set by converting each category to a proportional sector angle.
- Interpreting a circle graph7.C.11 — Interpret a circle graph to compare categories and answer questions about the underlying data.
Experimental Probability with Two Independent Events
- Running a two-event probability experiment7.C.12 — Conduct a probability experiment involving two independent events (like flipping a coin and rolling a die) and record the results.
- Calculating the experimental probability7.C.12 — Calculate the experimental probability of a combined outcome from two independent events using collected trial data.
The official wording — 2 outcomes in this unit
- 7.C.11
circle graphs
- 7.C.12
experimental probability with two independent events
Unit 6Financial LiteracyOfficial strand · Financial Literacy
Big Idea: percentages describe real financial situations like sales tax, discounts and simple interest. Solving financial problems using percent.
Financial Percentage
- Solving money problems with percent7.C.13 — Solve financial problems involving percent, such as sales tax, discounts and simple interest, on everyday purchases and savings.
The official wording — 1 outcome in this unit
- 7.C.13
financial literacy — financial percentage
Printable workbook · A keepsake of the year
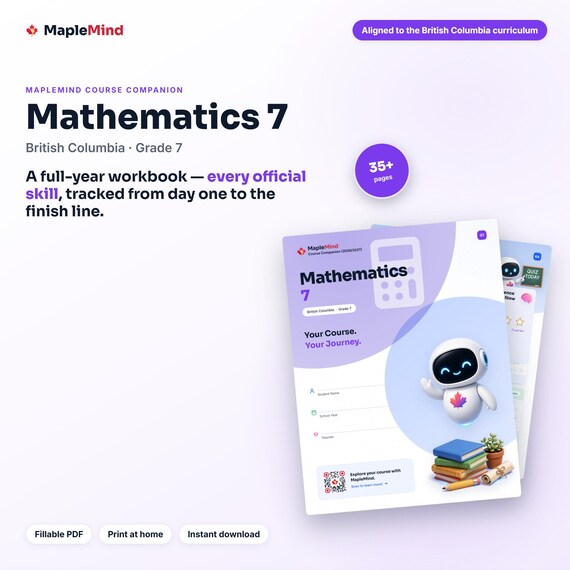
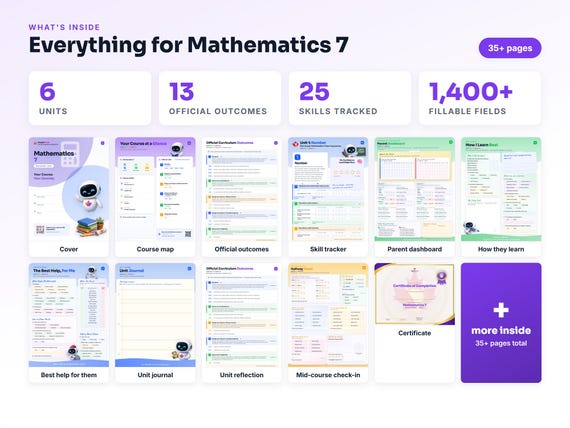
A Mathematics 7 workbook worth keeping
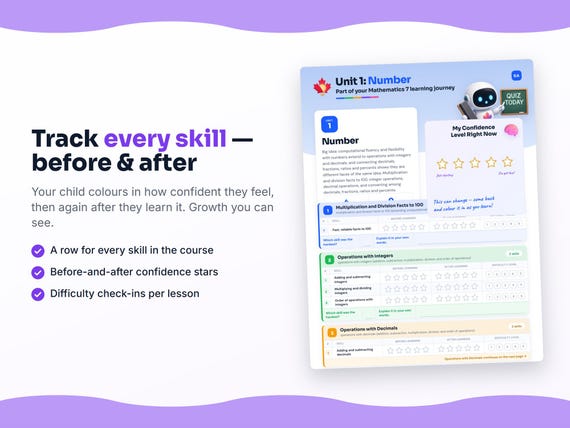
Built from the same official curriculum as this page. Before and after each skill above, your student colours in how sure they feel — so the two of you can see, on one page, what's clicking and what needs another look. It's a quiet way to follow how the year is really going.
By June it's full of their own handwriting: units worked through, confidence grown, a mid-year check-in, notes from parent-teacher night, and a certificate at the end. Less a worksheet, more a record of the year worth keeping on the shelf.
Instant download · see every page, reviews and the full description · five or more workbooks are $2.99 each
What it looks like in the app
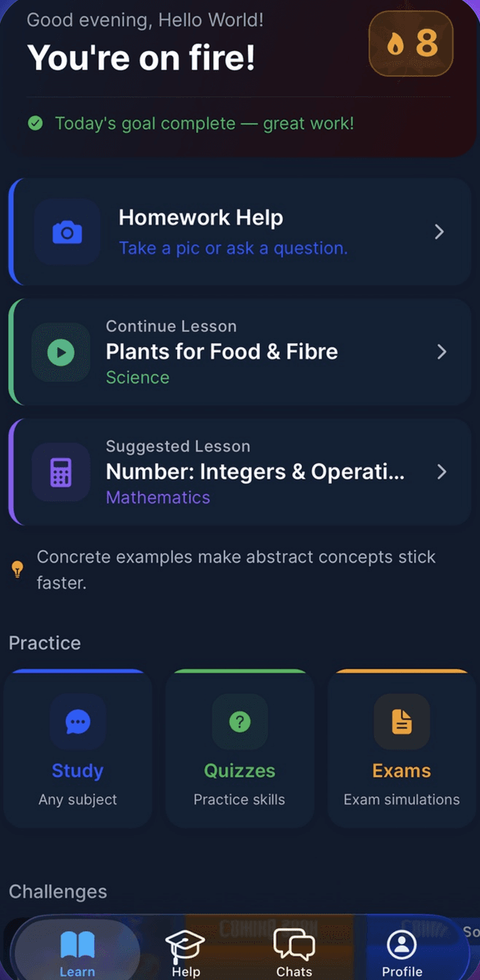
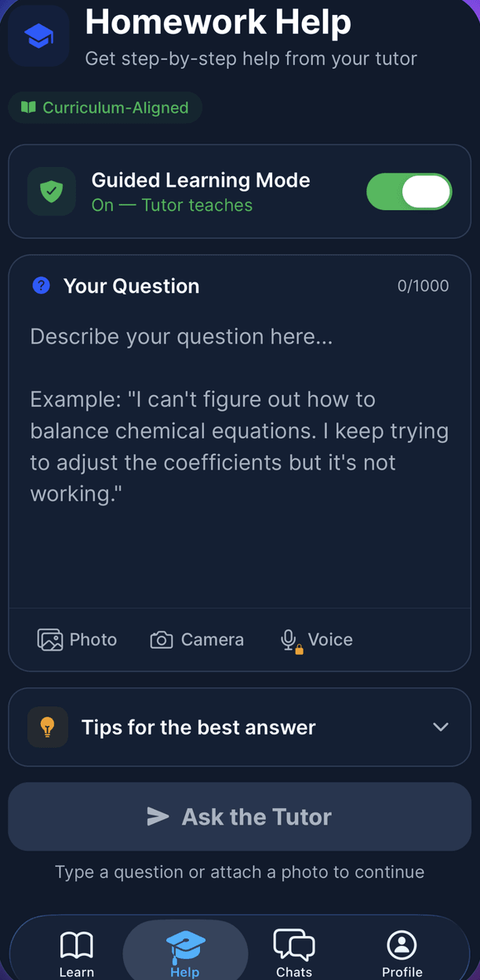
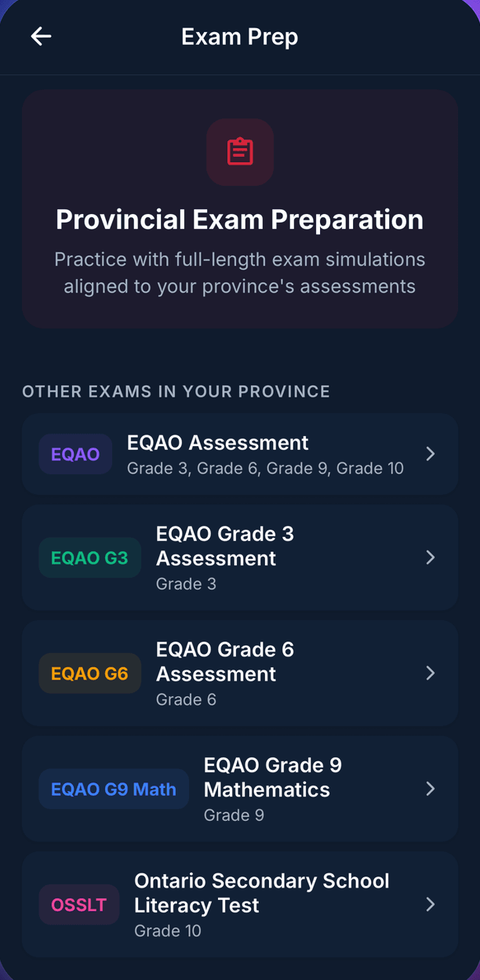
Preparing for the Grade 7 Foundation Skills Assessment (FSA)?
BC students write the Foundation Skills Assessment in Grade 7. MapleMind's practice mode builds familiar question formats from this course's skills.
Common questions
Can MapleMind help me with Mathematics 7?
Yes. MapleMind's AI tutor covers all 25 skills in British Columbia's Mathematics 7 — you pick the exact skill, and the tutor teaches it step by step: a short lesson, a worked example, solving together, then a skill check to show it stuck.
Is MapleMind aligned to British Columbia's official curriculum?
Yes. Every skill in this course maps to an official outcome code from British Columbia's Grade 7 Mathematics curriculum, and the ministry's own wording is quoted under each unit on this page — with the official government source linked so you can check it yourself.
What does MapleMind cost?
It's free to start — 5 tutoring chats and a practice quiz every day, no credit card. A Pro subscription ($9.99/month or $49.99/year CAD, 7-day free trial) unlocks unlimited tutoring, practice, and exam simulations.
What if I'm stuck on just one topic?
That's the point of skill-level tutoring: open Mathematics 7 in the app, tap the exact skill from the list on this page, and the tutor teaches just that — no wading through lessons you don't need.
Does MapleMind work in French or other languages?
Yes — 14 languages, including French. Both the app and the tutor's explanations switch to the language you choose.
Where can I see the official British Columbia curriculum for Mathematics 7?
The official source is linked on this page — BC's official mathematics curriculum. The outline here follows it: every MapleMind skill carries its official outcome code, and the ministry's own wording is quoted under each unit.
Does MapleMind help with the Grade 7 Foundation Skills Assessment (FSA)?
Yes. BC students write the Foundation Skills Assessment in Grade 7. MapleMind's practice mode builds familiar question formats from this course's skills.
Keep exploring
Ready when you are
Pick a skill from this page and see it taught properly — free, in the browser, in under a minute.