Get help with Mathematics, Grade 9 (De-streamed)
Most tutoring makes you sit through material you already know. MapleMind flips that: pick the exact skill that's causing trouble — any of the 51 below — and the tutor teaches just that one, step by step, as many times as it takes. Ask questions in plain words, any time of day, in English, French, or 12 other languages.
The official Ontario Mathematics, Grade 9 (De-streamed) curriculum
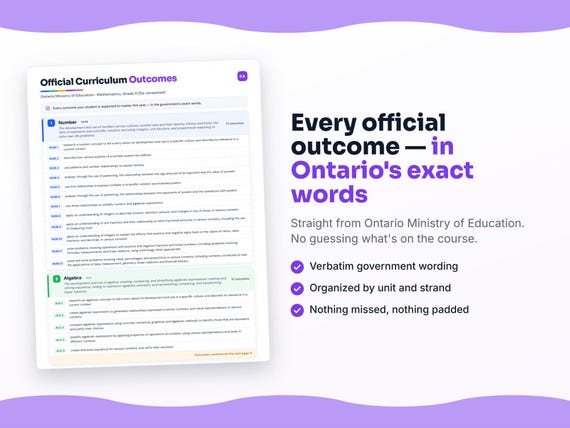
Ontario defines Mathematics, Grade 9 (De-streamed) by strands and outcomes. MapleMind teaches the same curriculum reorganized for one-skill-at-a-time tutoring — the table shows exactly where every official strand lands, and the ministry's own wording is quoted under each unit below.
Official source Ontario's official mathematics curriculumRead it on the government site — dcp.edu.gov.on.ca ↗| Official strand | Outcomes | Where MapleMind teaches it |
|---|---|---|
| Strand B | 14 | Number |
| Strand C | 15 | Algebra |
| Strand D | 9 | Data |
| Strand E | 8 | Geometry and Measurement |
| Strand F | 5 | Financial Literacy |
Ontario also defines Strand A — Social-Emotional Learning Skills — which the ministry teaches through every other strand rather than as its own unit, so it doesn't get a row of its own.
Every skill below, taught one on one.
 Try the first session free
How MapleMind teaches Mathematics, Grade 9 (De-streamed) — every unit, lesson, and skill
Every skill below runs as a short session: a plain-words lesson, a worked example, solving it together, then a five-question skill check that earns up to three stars. Guided Mode keeps it teaching instead of answer-handing — turning it off needs a parent's password.
Unit 1NumberOfficial strand · Strand B
The development and use of numbers across cultures; number sets and their density, infinity, and limits; the laws of exponents and scientific notation; and using integers, unit fractions, and proportional reasoning to solve real-life problems.
The Development and Use of Numbers
- Telling the story of a number concept across culturesmth1w.B1.1.a — Research a number concept to tell a story about its development and use in a specific culture, and describe its relevance today.
Number Sets
- Describing how subsets of a number system are definedmth1w.B1.2.a — Describe how various subsets of a number system are defined, like odd/even, prime/composite, rational/irrational, and perfect squares.
- Comparing similarities and differences between number subsetsmth1w.B1.2.b — Describe similarities and differences between different subsets of a number system, including how the same numbers can belong to more than one subset.
Density, Infinity, and Limit
- Using patterns to explain the density of a number setmth1w.B1.3.a — Use patterns and number relationships to explain the density of a number set — how likely a number of a particular type is to be found within a set of numbers.
- Using patterns to explain infinity and limitmth1w.B1.3.b — Use patterns and number relationships to explain infinity and limit as they relate to number sets, including patterns that extend indefinitely or approach a fixed value.
The Sign and Size of an Exponent
- Analysing how the sign and size of an exponent affects the value of a powermth1w.B2.1.a — Use patterning to analyse the relationship between the sign and size of an exponent and the value of a power, including zero and negative exponents.
Scientific Notation and Evaluating Powers
- Using the exponent relationship to write scientific notation and evaluate powersmth1w.B2.1.b — Use the sign-and-size relationship to express numbers in scientific notation and evaluate powers with rational bases and integer exponents.
The Exponent Laws
- Analysing the relationships between exponents and operations with powersmth1w.B2.2.a — Use patterning to analyse the relationships between the exponents of powers and operations with powers, deriving the product, quotient, and power-of-a-power laws.
Simplifying Expressions with the Exponent Laws
- Using the exponent laws to simplify numeric and algebraic expressionsmth1w.B2.2.b — Use the relationships between exponents and operations with powers to simplify numeric and algebraic expressions.
Integers to Describe Location, Direction, Amount, and Change
- Applying integers to describe location, direction, amount, and changemth1w.B3.1.a — Apply an understanding of integers to describe location, direction, amount, and changes in any of these, in different real-life contexts.
Unit Fractions and Measuring Tools
- Applying unit fractions and their relationship to other fractional amountsmth1w.B3.2.a — Apply an understanding of unit fractions and their relationship to other fractional amounts, including using measuring tools like tape measures and measuring cups.
Positive and Negative Signs on Ratios, Rates, Fractions, and Decimals
- Explaining the effects of positive and negative signs on ratios, rates, fractions, and decimalsmth1w.B3.3.a — Apply an understanding of integers to explain the effects that positive and negative signs have on the values of ratios, rates, fractions, and decimals.
Operations with Positive and Negative Fractions and Mixed Numbers
- Solving problems with operations on positive and negative fractions and mixed numbersmth1w.B3.4.a — Solve problems involving operations with positive and negative fractions and mixed numbers, including problems involving formulas, measurements, and linear relations.
Rates, Percentages, and Proportions
- Posing and solving problems involving rates, percentages, and proportionsmth1w.B3.5.a — Pose and solve problems involving rates, percentages, and proportions in different contexts, including data, measurement, geometry, linear relations, and financial literacy.
The official wording — 14 outcomes in this unit
- mth1w.B1.1.a
research a number concept to tell a story about its development and use in a specific culture, and describe its relevance in a current context
- mth1w.B1.2.a
describe how various subsets of a number system are defined
- mth1w.B1.2.b
describe similarities and differences between these subsets
- mth1w.B1.3.a
use patterns and number relationships to explain density
- mth1w.B1.3.b
infinity, and limit as they relate to number sets
- mth1w.B2.1.a
analyse, through the use of patterning, the relationship between the sign and size of an exponent and the value of a power
- mth1w.B2.1.b
use this relationship to express numbers in scientific notation and evaluate powers
- mth1w.B2.2.a
analyse, through the use of patterning, the relationships between the exponents of powers and the operations with powers
- mth1w.B2.2.b
use these relationships to simplify numeric and algebraic expressions
- mth1w.B3.1.a
apply an understanding of integers to describe location, direction, amount, and changes in any of these, in various contexts
- mth1w.B3.2.a
apply an understanding of unit fractions and their relationship to other fractional amounts, in various contexts, including the use of measuring tools
- mth1w.B3.3.a
apply an understanding of integers to explain the effects that positive and negative signs have on the values of ratios, rates, fractions, and decimals, in various contexts
- mth1w.B3.4.a
solve problems involving operations with positive and negative fractions and mixed numbers, including problems involving formulas, measurements, and linear relations, using technology when appropriate
- mth1w.B3.5.a
pose and solve problems involving rates, percentages, and proportions in various contexts, including contexts connected to real-life applications of data, measurement, geometry, linear relations, and financial literacy
Unit 2AlgebraOfficial strand · Strand C
The development and use of algebra; creating, comparing, and simplifying algebraic expressions; creating and solving equations; coding to represent algebraic concepts; and representing, comparing, and transforming linear relations.
The Development and Use of Algebra
- Telling the story of an algebraic concept across culturesmth1w.C1.1.a — Research an algebraic concept to tell a story about its development and use in a specific culture, and describe its relevance today.
Creating Algebraic Expressions to Generalize Relationships
- Creating algebraic expressions from words, numbers, and visualsmth1w.C1.2.a — Create algebraic expressions to generalize relationships expressed in words, numbers, and visual representations, in different contexts.
Comparing Algebraic Expressions for Equivalence
- Comparing expressions using concrete, numerical, graphical, and algebraic methodsmth1w.C1.3.a — Compare algebraic expressions using concrete, numerical, graphical, and algebraic methods to identify those that are equivalent, and justify the choices.
Simplifying Algebraic Expressions
- Simplifying algebraic expressions using properties of operationsmth1w.C1.4.a — Simplify algebraic expressions by applying properties of operations of numbers, using various representations and tools, in different contexts.
Creating and Solving Equations
- Creating and solving equations, and verifying solutionsmth1w.C1.5.a — Create and solve equations for different contexts, and verify the solutions using a strategy like substitution, a number line, or a graph.
Coding to Demonstrate Algebraic Concepts
- Using coding to demonstrate variables, parameters, equations, and inequalitiesmth1w.C2.1.a — Use coding to demonstrate an understanding of algebraic concepts including variables, parameters, equations, and inequalities.
Decomposing Situations into Computational Steps
- Creating code by decomposing a situation into computational stepsmth1w.C2.2.a — Create code by decomposing situations into computational steps in order to represent math concepts and relationships and to solve problems.
Reading and Altering Code
- Reading code to predict its outcome and altering it for new situationsmth1w.C2.3.a — Read code to predict its outcome, and alter code to adjust constraints, parameters, and outcomes to represent a similar or new math situation.
Comparing the Shapes of Graphs and Rates of Change
- Comparing the shapes of linear and non-linear graphs to describe rates of changemth1w.C3.1.a — Compare the shapes of graphs of linear and non-linear relations to describe their rates of change, connect them to growing and shrinking patterns, and make predictions.
Representing Linear Relations Four Ways
- Representing linear relations with materials, tables, graphs, and equationsmth1w.C3.2.a — Represent linear relations using concrete materials, tables of values, graphs, and equations, connecting the representations to understand rate of change and initial value.
Comparing Two Lines and Their Point of Intersection
- Comparing two lines y = ax + b and interpreting their point of intersectionmth1w.C3.3.a — Compare two linear relations of the form y = ax + b graphically and algebraically, and interpret the meaning of their point of intersection for a given context.
Comparing Characteristics of Relations
- Comparing characteristics of graphs, tables of values, and equationsmth1w.C4.1.a — Compare characteristics of graphs, tables of values, and equations of linear and non-linear relations, like rate of change, initial value, and symmetry.
Graphing Equation Forms and Their Inequalities
- Graphing relations of the forms x=k, y=k, x+y=k, x-y=k, ax+by=k, xy=k and their inequalitiesmth1w.C4.2.a — Graph relations represented as algebraic equations of the forms x = k, y = k, x + y = k, x - y = k, ax + by = k, and xy = k, and their associated inequalities, identifying characteristics and the points or regions they define.
Transforming Lines y = ax
- Translating, reflecting, and rotating lines y = axmth1w.C4.3.a — Translate, reflect, and rotate lines defined by y = ax, where a is a constant, and describe how each transformation affects the graph and equation of the line.
Determining the Equation of a Line
- Determining a line’s equation from rate of change and initial valuemth1w.C4.4.a — Determine the equations of lines from graphs, tables of values, and concrete representations by connecting rate of change to slope and initial value to y-intercept, and use these equations to solve problems.
The official wording — 15 outcomes in this unit
- mth1w.C1.1.a
research an algebraic concept to tell a story about its development and use in a specific culture, and describe its relevance in a current context
- mth1w.C1.2.a
create algebraic expressions to generalize relationships expressed in words, numbers, and visual representations, in various contexts
- mth1w.C1.3.a
compare algebraic expressions using concrete, numerical, graphical, and algebraic methods to identify those that are equivalent, and justify their choices
- mth1w.C1.4.a
simplify algebraic expressions by applying properties of operations of numbers, using various representations and tools, in different contexts
- mth1w.C1.5.a
create and solve equations for various contexts, and verify their solutions
- mth1w.C2.1.a
use coding to demonstrate an understanding of algebraic concepts including variables, parameters, equations, and inequalities
- mth1w.C2.2.a
create code by decomposing situations into computational steps in order to represent mathematical concepts and relationships, and to solve problems
- mth1w.C2.3.a
read code to predict its outcome, and alter code to adjust constraints, parameters, and outcomes to represent a similar or new mathematical situation
- mth1w.C3.1.a
compare the shapes of graphs of linear and non-linear relations to describe their rates of change, to make connections to growing and shrinking patterns, and to make predictions
- mth1w.C3.2.a
represent linear relations using concrete materials, tables of values, graphs, and equations, and make connections between the various representations to demonstrate an understanding of rates of change and initial values
- mth1w.C3.3.a
compare two linear relations of the form y = ax + b graphically and algebraically, and interpret the meaning of their point of intersection in terms of a given context
- mth1w.C4.1.a
compare characteristics of graphs, tables of values, and equations of linear and non-linear relations
- mth1w.C4.2.a
graph relations represented as algebraic equations of the forms x = k, y = k, x + y = k, x – y = k, ax + by = k, and xy = k, and their associated inequalities, where a, b, and k are constants, to identify various characteristics and the points and/or regions defined by these equations and inequalities
- mth1w.C4.3.a
translate, reflect, and rotate lines defined by y = ax, where a is a constant, and describe how each transformation affects the graphs and equations of the defined lines
- mth1w.C4.4.a
determine the equations of lines from graphs, tables of values, and concrete representations of linear relations by making connections between rates of change and slopes, and between initial values and y- intercepts, and use these equations to solve problems
Unit 3DataOfficial strand · Strand D
The implications of collecting and using large data sets; analysing one-variable data with quartiles and box plots; scatter plots, correlation, and regression models for two-variable data; and the full mathematical modelling process from question to report.
Implications of Collecting and Using Large Amounts of Data
- Describing implications of collecting, storing, and using large amounts of datamth1w.D1.1.a — Identify a current context involving a large amount of data, and describe the potential implications and consequences of collecting, storing, representing, and using it.
Single-Variable Data: Quartiles and Box Plots
- Representing and analysing single-variable data with quartiles and box plotsmth1w.D1.2.a — Represent and statistically analyse real-life single-variable data in various ways, including quartile values and box plots.
Creating a Scatter Plot for Two Variables
- Creating a scatter plot to represent a relationship between two variablesmth1w.D1.3.a — Create a scatter plot to represent the relationship between two variables, describing its direction, strength, outliers, and form.
Correlation, Regression Models, and Predictions
- Determining correlation and testing regression models to make predictionsmth1w.D1.3.b — Determine the correlation between two variables by testing different regression models using technology, and use a model to make predictions when appropriate.
The Value of Mathematical Modelling
- Describing the value of mathematical modelling in real lifemth1w.D2.1.a — Describe the value of mathematical modelling and how it is used in real life to inform decisions.
Modelling Step 1: Identify the Question
- Identifying a question of interest and the information needed to answer itmth1w.D2.2.a — Identify a question of interest requiring the collection and analysis of data, and identify the information needed to answer the question.
Modelling Step 2: Plan and Collect the Data
- Creating a plan to collect data, identifying assumptions and what variesmth1w.D2.3.a — Create a plan to collect the necessary data from an appropriate source, identify assumptions and what may vary or stay the same, and carry out the plan.
Modelling Step 3: Display, Analyse, and Build the Model
- Displaying and analysing data to build a mathematical modelmth1w.D2.4.a — Determine ways to display and analyse the data in order to create a mathematical model that answers the original question of interest.
Modelling Step 4: Report, Evaluate, and Predict
- Reporting how a model answers the question, its limitations, and what it predictsmth1w.D2.5.a — Report how the model can be used to answer the question of interest, how well it fits the context, its limitations, and what predictions can be made from it.
The official wording — 9 outcomes in this unit
- mth1w.D1.1.a
identify a current context involving a large amount of data, and describe potential implications and consequences of its collection, storage, representation, and use
- mth1w.D1.2.a
represent and statistically analyse data from a real-life situation involving a single variable in various ways, including the use of quartile values and box plots
- mth1w.D1.3.a
create a scatter plot to represent the relationship between two variables
- mth1w.D1.3.b
determine the correlation between these variables by testing different regression models using technology, and use a model to make predictions when appropriate
- mth1w.D2.1.a
describe the value of mathematical modelling and how it is used in real life to inform decisions
- mth1w.D2.2.a
identify a question of interest requiring the collection and analysis of data, and identify the information needed to answer the question
- mth1w.D2.3.a
create a plan to collect the necessary data on the question of interest from an appropriate source, identify assumptions, identify what may vary and what may remain the same in the situation, and then carry out the plan
- mth1w.D2.4.a
determine ways to display and analyse the data in order to create a mathematical model to answer the original question of interest, taking into account the nature of the data, the context, and the assumptions made
- mth1w.D2.5.a
report how the model can be used to answer the question of interest, how well the model fits the context, potential limitations of the model, and what predictions can be made based on the model
Unit 4Geometry and MeasurementOfficial strand · Strand E
The development of geometric concepts and measurement systems across cultures; circle and triangle geometric designs; converting between measurement systems; how changing dimensions affects perimeter, area, and volume; the Pythagorean relationship; and the volume relationships between prisms/pyramids and cylinders/cones.
The Story of a Geometric Concept or Measurement System
- Telling the story of a geometric concept or measurement system across culturesmth1w.E1.1.a — Research a geometric concept or measurement system to tell a story about its development and use in a specific culture, connecting it to careers and other disciplines.
Geometric Designs with Circle Properties
- Creating and analysing designs using circle propertiesmth1w.E1.2.a — Create and analyse designs involving circle properties, such as inscribed and central angles, chord bisectors, and angles subtended from the diameter.
Geometric Designs with Triangle and Angle Properties
- Creating and analysing designs using triangle and angle propertiesmth1w.E1.2.b — Create and analyse designs involving triangle and angle properties, such as parallel-line angle relationships, polygon angle sums, and triangle side-angle relationships.
Converting Within and Between Measurement Systems
- Solving problems converting units within and between measurement systemsmth1w.E1.3.a — Solve problems involving different units within a measurement system and between measurement systems, including systems from different cultures or communities.
The Effect of Changing Dimensions
- Showing how changing dimensions affects perimeter, area, surface area, and volumemth1w.E1.4.a — Show how changing one or more dimensions of a 2D shape or 3D object affects perimeter/circumference, area, surface area, and volume.
Right Triangles in Real-Life and Composite Shapes
- Solving right-triangle side-length problems in real life and composite shapesmth1w.E1.5.a — Solve problems involving the side-length relationship for right triangles in real-life situations, including problems involving composite shapes.
The Volume Relationship Between Prisms and Pyramids
- Applying the volume relationship between prisms and pyramidsmth1w.E1.6.a — Solve problems using the relationship between the volume of a prism and a pyramid with the same base and height, involving different units of measure.
The Volume Relationship Between Cylinders and Cones
- Applying the volume relationship between cylinders and conesmth1w.E1.6.b — Solve problems using the relationship between the volume of a cylinder and a cone with the same base and height, involving different units of measure.
The official wording — 8 outcomes in this unit
- mth1w.E1.1.a
research a geometric concept or a measurement system to tell a story about its development and use in a specific culture or community, and describe its relevance in connection to careers and to other disciplines
- mth1w.E1.2.a
create and analyse designs involving geometric relationships and circle and triangle properties, using various tools
- mth1w.E1.2.b
create and analyse designs involving geometric relationships and circle and triangle properties, using various tools
- mth1w.E1.3.a
solve problems involving different units within a measurement system and between measurement systems, including those from various cultures or communities, using various representations and technology, when appropriate
- mth1w.E1.4.a
show how changing one or more dimensions of a two-dimensional shape and a three-dimensional object affects perimeter/circumference, area, surface area, and volume, using technology when appropriate
- mth1w.E1.5.a
solve problems involving the side-length relationship for right triangles in real-life situations, including problems that involve composite shapes
- mth1w.E1.6.a
the relationships between the volume of prisms and pyramids
- mth1w.E1.6.b
the volume of cylinders and cones, involving various units of measure
Unit 5Financial LiteracyOfficial strand · Strand F
Using past and current financial situations to inform decisions; appreciation and depreciation graphs; how interest rate, calculation method, borrowing time, and down payments affect the cost of a purchase; and modifying a budget for changed circumstances.
How a Financial Situation Informs Decisions
- Explaining how a past or current financial situation informs decisionsmth1w.F1.1.a — Identify a past or current financial situation and explain how it can inform financial decisions, applying an understanding of its context and related math knowledge.
Appreciation and Depreciation
- Using graphs to answer questions about appreciation and depreciationmth1w.F1.2.a — Identify financial situations that involve appreciation and depreciation, and use associated graphs to answer related questions.
How Interest Rate and Calculation Method Affect Cost
- Comparing how interest rate and calculation method affect overall costmth1w.F1.3.a — Compare the effects that different interest rates and ways of calculating interest (simple vs compound) have on the overall cost of purchasing goods or services.
How Borrowing Time and Down Payment Affect Cost
- Comparing how borrowing time and down payment amount affect overall costmth1w.F1.3.b — Compare the effects that different lengths of borrowing time and amounts of down payments have on the overall cost of purchasing goods or services.
Modifying a Budget for Changed Circumstances
- Modifying a budget to reflect changed circumstances, with a rationalemth1w.F1.4.a — Modify budgets displayed in various ways to reflect specific changes in circumstances, and provide a rationale for the modifications.
The official wording — 5 outcomes in this unit
- mth1w.F1.1.a
identify a past or current financial situation and explain how it can inform financial decisions, by applying an understanding of the context of the situation and related mathematical knowledge
- mth1w.F1.2.a
identify financial situations that involve appreciation and depreciation, and use associated graphs to answer related questions
- mth1w.F1.3.a
compare the effects that different interest rates, lengths of borrowing time, ways in which interest is calculated, and amounts of down payments have on the overall costs associated with purchasing goods or services, using appropriate tools
- mth1w.F1.3.b
compare the effects that different interest rates, lengths of borrowing time, ways in which interest is calculated, and amounts of down payments have on the overall costs associated with purchasing goods or services, using appropriate tools
- mth1w.F1.4.a
modify budgets displayed in various ways to reflect specific changes in circumstances, and provide a rationale for the modifications
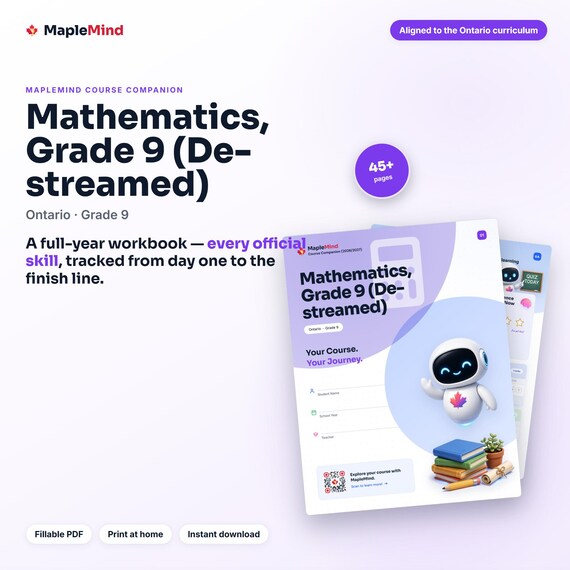
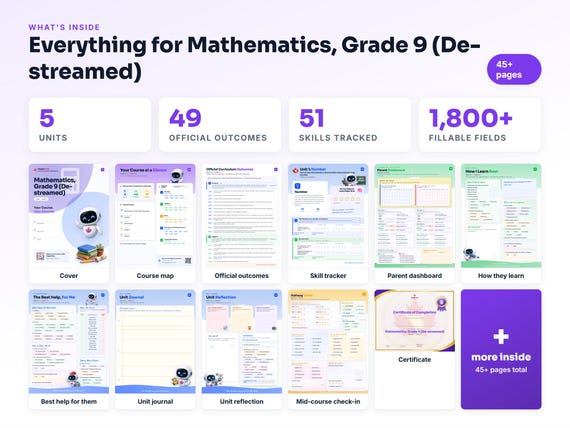

Printable workbook · A keepsake of the year
A Mathematics, Grade 9 (De-streamed) workbook worth keeping
Built from the same official curriculum as this page. Before and after each skill above, your student colours in how sure they feel — so the two of you can see, on one page, what's clicking and what needs another look. It's a quiet way to follow how the year is really going.
By June it's full of their own handwriting: units worked through, confidence grown, a mid-year check-in, notes from parent-teacher night, and a certificate at the end. Less a worksheet, more a record of the year worth keeping on the shelf.
Instant download · see every page, reviews and the full description · five or more workbooks are $2.99 each
What it looks like in the app
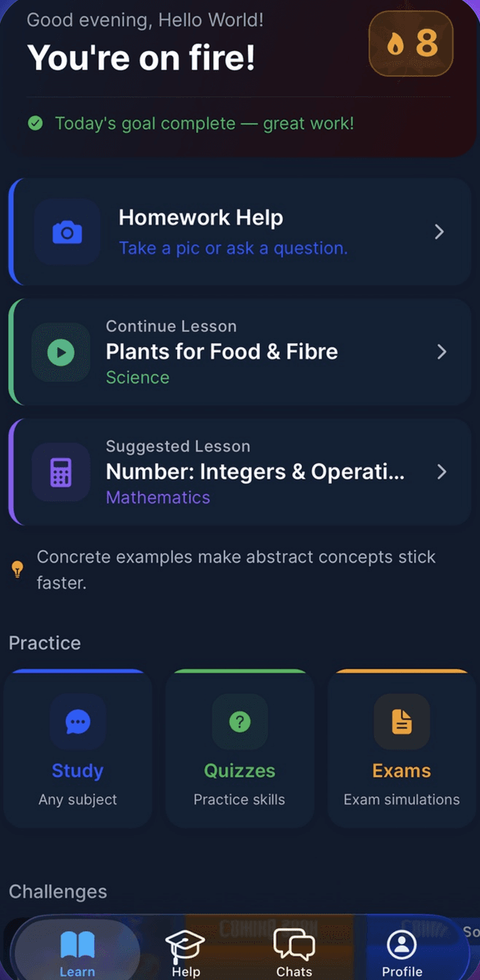
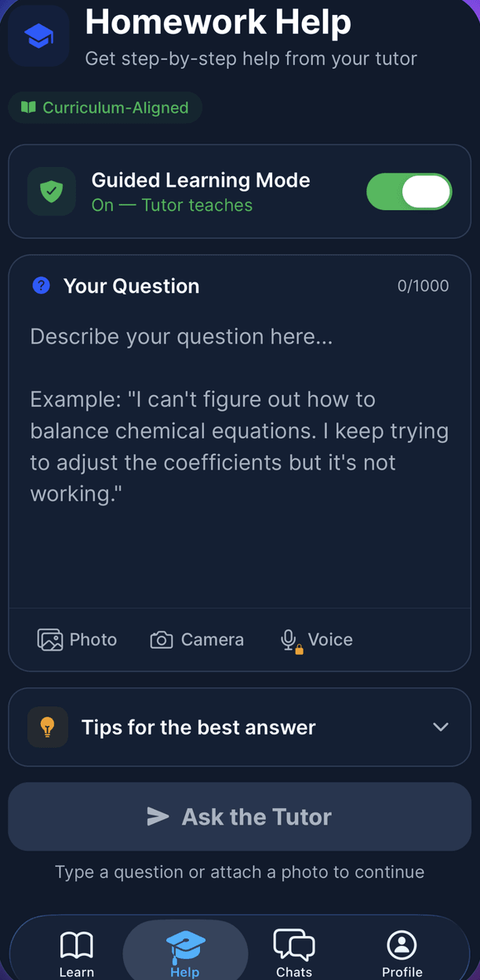
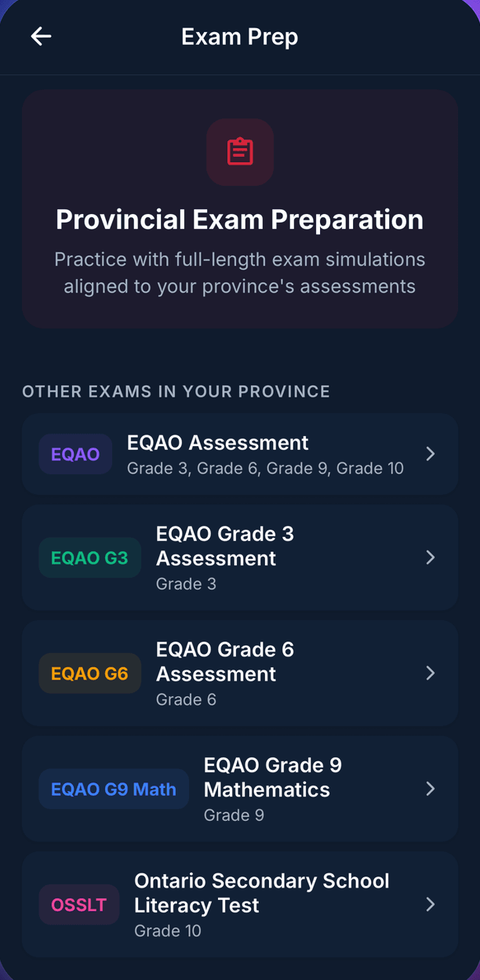
Preparing for the EQAO Grade 9 Math assessment?
Ontario's EQAO Grade 9 Math assessment draws straight from this curriculum. MapleMind's exam mode runs a timed simulation and grades it, so the real day has no surprises. Our EQAO prep guide has a full study plan.
Common questions
Can MapleMind help me with Mathematics, Grade 9 (De-streamed)?
Yes. MapleMind's AI tutor covers all 51 skills in Ontario's Mathematics, Grade 9 (De-streamed) — you pick the exact skill, and the tutor teaches it step by step: a short lesson, a worked example, solving together, then a skill check to show it stuck.
Is MapleMind aligned to Ontario's official curriculum?
Yes. Every skill in this course maps to an official outcome code from Ontario's Grade 9 Mathematics curriculum, and the ministry's own wording is quoted under each unit on this page — with the official government source linked so you can check it yourself.
What does MapleMind cost?
It's free to start — 5 tutoring chats and a practice quiz every day, no credit card. A Pro subscription ($9.99/month or $49.99/year CAD, 7-day free trial) unlocks unlimited tutoring, practice, and exam simulations.
What if I'm stuck on just one topic?
That's the point of skill-level tutoring: open Mathematics, Grade 9 (De-streamed) in the app, tap the exact skill from the list on this page, and the tutor teaches just that — no wading through lessons you don't need.
Does MapleMind work in French or other languages?
Yes — 14 languages, including French. Both the app and the tutor's explanations switch to the language you choose.
Where can I see the official Ontario curriculum for Mathematics, Grade 9 (De-streamed)?
The official source is linked on this page — Ontario's official mathematics curriculum. The outline here follows it: every MapleMind skill carries its official outcome code, and the ministry's own wording is quoted under each unit.
Does MapleMind help with the EQAO Grade 9 Math assessment?
Yes. Ontario's EQAO Grade 9 Math assessment draws straight from this curriculum. MapleMind's exam mode runs a timed simulation and grades it, so the real day has no surprises.
Keep exploring
Ready when you are
Pick a skill from this page and see it taught properly — free, in the browser, in under a minute.