Get help with Foundations of Mathematics, Grade 10 (Applied)
Most tutoring makes you sit through material you already know. MapleMind flips that: pick the exact skill that's causing trouble — any of the 34 below — and the tutor teaches just that one, step by step, as many times as it takes. Ask questions in plain words, any time of day, in English, French, or 12 other languages.
The official Ontario Foundations of Mathematics, Grade 10 (Applied) curriculum
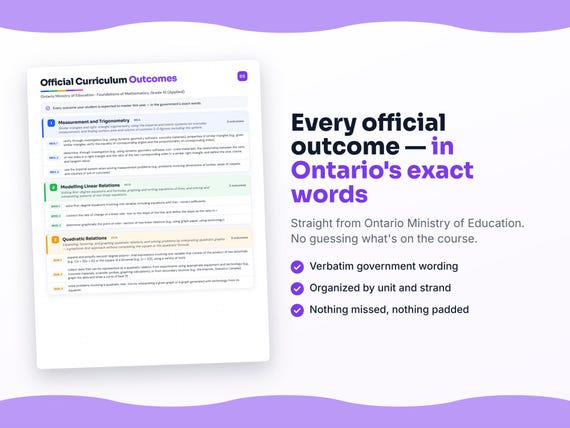
Ontario defines Foundations of Mathematics, Grade 10 (Applied) by strands and outcomes. MapleMind teaches the same curriculum reorganized for one-skill-at-a-time tutoring — the table shows exactly where every official strand lands, and the ministry's own wording is quoted under each unit below.
Official source Ontario's official mathematics curriculumRead it on the government site — dcp.edu.gov.on.ca ↗| Official strand | Outcomes | Where MapleMind teaches it |
|---|---|---|
| Strand 1 | 12 | Measurement and Trigonometry |
| Strand 2 | 12 | Modelling Linear Relations |
| Strand 3 | 10 | Quadratic Relations |
Every skill below, taught one on one.
 Try the first session free
How MapleMind teaches Foundations of Mathematics, Grade 10 (Applied) — every unit, lesson, and skill
Every skill below runs as a short session: a plain-words lesson, a worked example, solving it together, then a five-question skill check that earns up to three stars. Guided Mode keeps it teaching instead of answer-handing — turning it off needs a parent's password.
Unit 1Measurement and TrigonometryOfficial strand · Strand 1
Similar triangles and right-triangle trigonometry, using the imperial and metric systems for everyday measurement, and finding surface area and volume of common 3-D figures, including the sphere.
Similar Triangles
- Verifying properties of similar trianglesmfm2p.1.1.1 — Verify, using dynamic geometry software or concrete materials, that similar triangles have equal corresponding angles and proportional corresponding sides.
- Finding side lengths in similar trianglesmfm2p.1.1.2 — Use proportional reasoning to determine unknown side lengths of similar triangles.
- Solving real problems with similar trianglesmfm2p.1.1.3 — Solve realistic problems involving similar triangles, such as finding a tree's height using shadows and a metre stick.
Right-Triangle Trigonometry
- Defining the sine, cosine, and tangent ratiosmfm2p.1.2.1 — Investigate the relationship between side ratios in similar right triangles, and use it to define the sine, cosine, and tangent ratios.
- Finding sides and angles in right trianglesmfm2p.1.2.2 — Determine unknown side lengths and angle measures in right triangles using the primary trigonometric ratios and the Pythagorean theorem.
- Solving real-life right-triangle problemsmfm2p.1.2.3 — Solve real-life right-triangle problems, such as building a kite and finding its height using a clinometer and the tangent ratio.
- Exploring how an occupation uses trigonometrymfm2p.1.2.4 — Take part in an activity that shows how trigonometry is used in a real job, such as surveying or carpentry, and describe what was learned.
Surface Area and Volume, Imperial and Metric
- Using the imperial system to solve measurement problemsmfm2p.1.3.1 — Use the imperial system to solve measurement problems, such as dimensions of lumber, areas of carpet, or volumes of soil or concrete.
- Converting between imperial and metric measurementsmfm2p.1.3.2 — Convert between the imperial and metric systems, and within each system, to solve everyday measurement problems.
- Finding the surface area of a pyramidmfm2p.1.3.3 — Investigate and describe the relationship used to find the surface area of a pyramid, using a net of a square-based pyramid.
- Solving surface area and volume problemsmfm2p.1.3.4 — Solve problems involving the surface areas of prisms, pyramids, and cylinders, and the volumes of prisms, pyramids, cylinders, and cones, using metric or imperial units as appropriate.
- Developing the volume formula for a spheremfm2p.MT.ADD1 — Develop the formula for the volume of a sphere using concrete materials and the volume relationships between cylinders, cones, and spheres.
The official wording — 12 outcomes in this unit
- mfm2p.1.1.1
verify, through investigation (e.g., using dynamic geometry software, concrete materials), properties of similar triangles (e.g., given similar triangles, verify the equality of corresponding angles and the proportionality of corresponding sides);
- mfm2p.1.1.2
determine the lengths of sides of similar triangles, using proportional reasoning;
- mfm2p.1.1.3
solve problems involving similar triangles in realistic situations (e.g., shadows, reflec- tions, scale models, surveying)
- mfm2p.1.2.1
determine, through investigation (e.g., using dynamic geometry software, con- crete materials), the relationship between the ratio of two sides in a right triangle and the ratio of the two corresponding sides in a similar right triangle, and define the sine, cosine, and tangent ratios
- mfm2p.1.2.2
determine the measures of the sides and angles in right triangles, using the primary opposite hypotenuse trigonometric ratios and the Pythagorean theorem;
- mfm2p.1.2.3
solve problems involving the measures of sides and angles in right triangles in real- life applications
- mfm2p.1.2.4
describe, through participation in an activity, the application of trigonometry in an occupation
- mfm2p.1.3.1
use the imperial system when solving measurement problems (e.g., problems involving dimensions of lumber, areas of carpets, and volumes of soil or concrete);
- mfm2p.1.3.2
perform everyday conversions between the imperial system and the metric system (e.g., millilitres to cups, centimetres to inches) and within these systems
- mfm2p.1.3.3
determine, through investigation, the rela- tionship for calculating the surface area of a pyramid (e.g., use the net of a square- based pyramid to determine that the sur- face area is the area of the square base plus the areas of the four congruent triangles);
- mfm2p.1.3.4
solve problems involving the surface areas of prisms, pyramids, and cylinders, and the volumes of prisms, pyramids, cylinders, cones, and spheres, including problems involving combinations of these figures, using the metric system or the imperial system, as appropriate
- mfm2p.MT.ADD1
develop the formula for the volume of a sphere, using concrete materials and the volume relationships between cylinders, cones, and spheres.
Unit 2Modelling Linear RelationsOfficial strand · Strand 2
Solving first-degree equations and formulas, graphing and writing equations of lines, and solving and interpreting systems of two linear equations.
Solving First-Degree Equations
- Solving first-degree equations, including fractional coefficientsmfm2p.2.1.1 — Solve first-degree equations in one variable, including equations with fractional coefficients, using the balance analogy, computer algebra systems, or paper and pencil.
- Finding the value of a variable using a formulamfm2p.2.1.2 — Determine the value of a first-degree variable in a formula, either by isolating the variable first or by substituting known values first.
- Rewriting a line's equation in y = mx + b formmfm2p.2.1.3 — Express the equation of a line in the form y = mx + b, given the form Ax + By + C = 0.
Graphing and Writing Equations of Lines
- Connecting rate of change to slopemfm2p.2.2.1 — Connect the rate of change of a linear relation to the slope of its line, and define slope as the ratio rise/run.
- Recognizing y = mx + b and the special cases x = a, y = bmfm2p.2.2.2 — Identify y = mx + b as a common form for the equation of a straight line, and identify the special cases x = a and y = b.
- The geometric meaning of m and bmfm2p.2.2.3 — Investigate with technology what the slope (m) and y-intercept (b) mean geometrically in the equation y = mx + b.
- Exploring properties of slopemfm2p.2.2.4 — Investigate properties of the slopes of lines and line segments, such as direction, positive or negative rate of change, steepness, and parallelism, using graphing technology.
- Graphing lines by handmfm2p.2.2.5 — Graph lines by hand using a variety of techniques, such as using the y-intercept and slope, or using the x- and y-intercepts.
- Determining a line's equation from a graph, slope-intercept, slope-point, or two pointsmfm2p.2.2.6 — Determine the equation of a line given its graph, its slope and y-intercept, its slope and a point on it, or two points on it.
Solving and Interpreting Systems of Linear Equations
- Finding the point of intersection graphicallymfm2p.2.3.1 — Determine graphically the point of intersection of two linear relations, using graph paper or technology.
- Solving linear systems algebraicallymfm2p.2.3.2 — Solve a system of two linear equations with integer coefficients algebraically, using substitution or elimination.
- Solving realistic problems with linear systemsmfm2p.2.3.3 — Solve realistic problems described in words or represented by a linear system of two equations, choosing an algebraic or graphical method, such as comparing two salary offers.
The official wording — 12 outcomes in this unit
- mfm2p.2.1.1
solve first-degree equations involving one variable, including equations with frac- tional coefficients
- mfm2p.2.1.2
determine the value of a variable in the first degree, using a formula (i.e., by isolating the variable and then substituting known values; by substituting known values and then solving for the variable)
- mfm2p.2.1.3
express the equation of a line in the form y = mx + b, given the form Ax + By + C = 0.
- mfm2p.2.2.1
connect the rate of change of a linear rela- tion to the slope of the line, and define the slope as the ratio m =
- mfm2p.2.2.2
identify, through investigation, y = mx + b as a common form for the equation of a straight line, and identify the special cases x = a, y = b;
- mfm2p.2.2.3
identify, through investigation with tech- nology, the geometric significance of m and b in the equation y = mx + b;
- mfm2p.2.2.4
identify, through investigation, properties of the slopes of lines and line segments (e.g., direction, positive or negative rate of change, steepness, parallelism), using graphing technology to facilitate investiga- tions, where appropriate;
- mfm2p.2.2.5
graph lines by hand, using a variety of techniques (e.g., graph using the y-intercept and slope; graph 2x + 3y = 6 using the x- and y-intercepts);
- mfm2p.2.2.6
determine the equation of a line, given its graph, the slope and y-intercept, the slope and a point on the line, or two points on the line.
- mfm2p.2.3.1
determine graphically the point of inter- section of two linear relations (e.g., using graph paper, using technology)
- mfm2p.2.3.2
solve systems of two linear equations involving two variables with integral coefficients, using the algebraic method of substitution or elimination
- mfm2p.2.3.3
solve problems that arise from realistic sit- uations described in words or represented by given linear systems of two equations involving two variables, by choosing an appropriate algebraic or graphical method
Unit 3Quadratic RelationsOfficial strand · Strand 3
Expanding, factoring, and graphing quadratic relations, and solving problems by interpreting quadratic graphs — a graphical-first approach without completing the square or the quadratic formula.
Identifying Characteristics of Quadratic Relations
- Expanding and simplifying products and squares of binomialsmfm2p.3.1.1 — Expand and simplify second-degree expressions that are the product of two binomials or the square of a binomial, using algebra tiles or other tools.
- Factoring binomials and trinomials using a common factormfm2p.3.1.2 — Factor binomials and trinomials by determining a common factor, using algebra tiles or other tools.
- Factoring simple trinomials x² + bx + cmfm2p.3.1.3 — Factor simple trinomials of the form x² + bx + c, such as x² + 7x + 10 or x² + 2x − 8.
- Factoring the difference of squaresmfm2p.3.1.4 — Factor differences of squares of the form x² − a², such as x² − 16.
Graphing Quadratic Relations
- Collecting and graphing quadratic datamfm2p.3.2.1 — Collect data that forms a quadratic relation from an experiment or a secondary source, graph it, and draw a curve of best fit.
- Recognizing a parabola from a table of second differencesmfm2p.3.2.2 — Use technology to show that a quadratic relation y = ax² + bx + c graphs as a parabola and that its table of values has a constant second difference.
- Identifying the key features of a parabolamfm2p.3.2.3 — Identify a parabola's axis of symmetry, vertex, y-intercept, zeros, and maximum or minimum value from a given or technology-generated graph, using correct terminology.
- Comparing standard-form and factored-form graphsmfm2p.3.2.4 — Compare, using technology, the graphs of a quadratic relation in standard form and in factored form, and describe how each form connects to the graph.
Solving Problems by Interpreting Graphs of Quadratic Relations
- Solving quadratic problems by interpreting a graphmfm2p.3.3.1 — Solve a problem involving a quadratic relation by interpreting a given or technology-generated graph, such as finding the maximum height and landing time of a thrown ball.
- Interpreting key features from an experimental quadratic graphmfm2p.3.3.2 — Solve problems by interpreting the key features of a graph made from experimental data, such as the vertex and intercepts of a can-rolling experiment.
The official wording — 10 outcomes in this unit
- mfm2p.3.1.1
expand and simplify second-degree polyno- mial expressions involving one variable that consist of the product of two binomials [e.g., (2x + 3)(x + 4)] or the square of a binomial [e.g., (x + 3)2], using a variety of tools
- mfm2p.3.1.2
factor binomials (e.g., 4x2 + 8x) and trino- mials (e.g., 3x2 + 9x – 15) involving one variable up to degree two, by determining a common factor using a variety of tools
- mfm2p.3.1.3
factor simple trinomials of the form x2 + bx + c (e.g., x2 + 7x + 10, x2 + 2x – 8), using a variety of tools
- mfm2p.3.1.4
factor the difference of squares of the form x2 – a2 (e.g., x2 – 16).
- mfm2p.3.2.1
collect data that can be represented as a quadratic relation, from experiments using appropriate equipment and technology (e.g., concrete materials, scientific probes, graphing calculators), or from secondary sources (e.g., the Internet, Statistics Canada); graph the data and draw a curve of best fit
- mfm2p.3.2.2
determine, through investigation using technology, that a quadratic relation of the form y = ax2 + bx + c (a ≠ 0) can be graph- ically represented as a parabola, and deter- mine that the table of values yields a con- stant second difference
- mfm2p.3.2.3
identify the key features of a graph of a parabola (i.e., the equation of the axis of symmetry, the coordinates of the vertex, the y-intercept, the zeros, and the maximum or minimum value), using a given graph or a graph generated with technology from its equation, and use the appropriate terminol- ogy to describe the features;
- mfm2p.3.2.4
compare, through investigation using tech- nology, the graphical representations of a quadratic relation in the form y = x2 + bx + c and the same relation in the factored form y = (x – r)(x – s)
- mfm2p.3.3.1
solve problems involving a quadratic rela- tion by interpreting a given graph or a graph generated with technology from its equation
- mfm2p.3.3.2
solve problems by interpreting the signifi- cance of the key features of graphs obtained by collecting experimental data involving quadratic relations
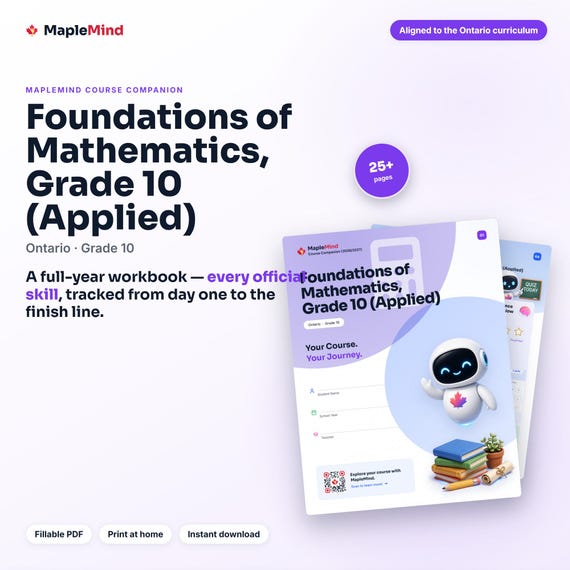
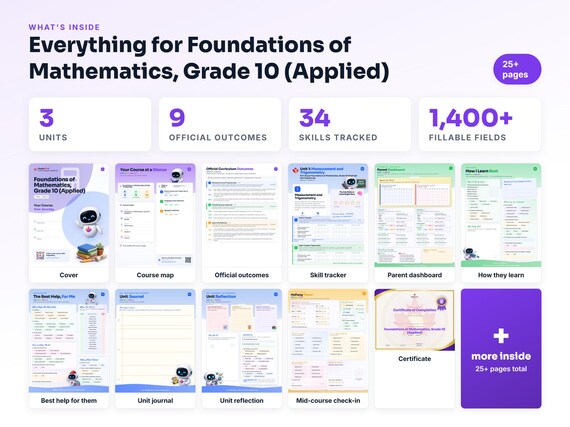

Printable workbook · A keepsake of the year
A Foundations of Mathematics, Grade 10 (Applied) workbook worth keeping
Built from the same official curriculum as this page. Before and after each skill above, your student colours in how sure they feel — so the two of you can see, on one page, what's clicking and what needs another look. It's a quiet way to follow how the year is really going.
By June it's full of their own handwriting: units worked through, confidence grown, a mid-year check-in, notes from parent-teacher night, and a certificate at the end. Less a worksheet, more a record of the year worth keeping on the shelf.
Instant download · see every page, reviews and the full description · five or more workbooks are $2.99 each
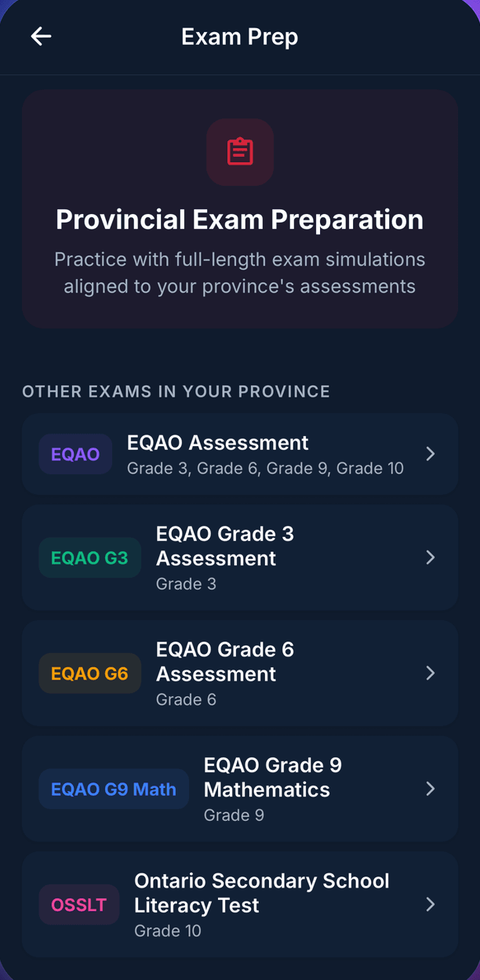
What it looks like in the app


Common questions
Can MapleMind help me with Foundations of Mathematics, Grade 10 (Applied)?
Yes. MapleMind's AI tutor covers all 34 skills in Ontario's Foundations of Mathematics, Grade 10 (Applied) — you pick the exact skill, and the tutor teaches it step by step: a short lesson, a worked example, solving together, then a skill check to show it stuck.
Is MapleMind aligned to Ontario's official curriculum?
Yes. Every skill in this course maps to an official outcome code from Ontario's Grade 10 Mathematics curriculum, and the ministry's own wording is quoted under each unit on this page — with the official government source linked so you can check it yourself.
What does MapleMind cost?
It's free to start — 5 tutoring chats and a practice quiz every day, no credit card. A Pro subscription ($9.99/month or $49.99/year CAD, 7-day free trial) unlocks unlimited tutoring, practice, and exam simulations.
What if I'm stuck on just one topic?
That's the point of skill-level tutoring: open Foundations of Mathematics, Grade 10 (Applied) in the app, tap the exact skill from the list on this page, and the tutor teaches just that — no wading through lessons you don't need.
Does MapleMind work in French or other languages?
Yes — 14 languages, including French. Both the app and the tutor's explanations switch to the language you choose.
Where can I see the official Ontario curriculum for Foundations of Mathematics, Grade 10 (Applied)?
The official source is linked on this page — Ontario's official mathematics curriculum. The outline here follows it: every MapleMind skill carries its official outcome code, and the ministry's own wording is quoted under each unit.
Keep exploring
Ready when you are
Pick a skill from this page and see it taught properly — free, in the browser, in under a minute.