Get help with Foundations for College Mathematics, Grade 11 (College)
Most tutoring makes you sit through material you already know. MapleMind flips that: pick the exact skill that's causing trouble — any of the 57 below — and the tutor teaches just that one, step by step, as many times as it takes. Ask questions in plain words, any time of day, in English, French, or 12 other languages.
The official Ontario Foundations for College Mathematics, Grade 11 (College) curriculum
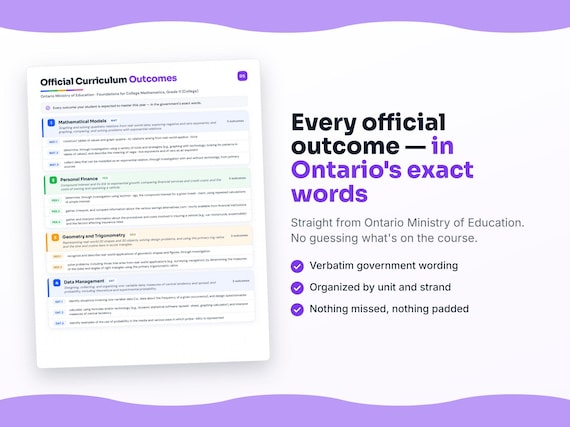
Ontario defines Foundations for College Mathematics, Grade 11 (College) by strands and outcomes. MapleMind teaches the same curriculum reorganized for one-skill-at-a-time tutoring — the table shows exactly where every official strand lands, and the ministry's own wording is quoted under each unit below.
Official source Ontario's official mathematics curriculumRead it on the government site — dcp.edu.gov.on.ca ↗| Official strand | Outcomes | Where MapleMind teaches it |
|---|---|---|
| Strand A | 19 | Mathematical Models |
| Strand B | 14 | Personal Finance |
| Strand C | 8 | Geometry and Trigonometry |
| Strand D | 16 | Data Management |
Every skill below, taught one on one.
 Try the first session free
How MapleMind teaches Foundations for College Mathematics, Grade 11 (College) — every unit, lesson, and skill
Every skill below runs as a short session: a plain-words lesson, a worked example, solving it together, then a five-question skill check that earns up to three stars. Guided Mode keeps it teaching instead of answer-handing — turning it off needs a parent's password.
Unit 1Mathematical ModelsOfficial strand · Strand A
Graphing and solving quadratic relations from real-world data; exploring negative and zero exponents; and graphing, comparing, and solving problems with exponential relations.
Connecting Graphs and Equations of Quadratic Relations
- Building tables of values and graphing quadratic relationsmbf3c.1.1 — Construct tables of values and graph quadratic relations from real-world applications, like a dropped ball or a cube's changing surface area.
- Interpreting meaningful values from a quadratic graphmbf3c.1.2 — Determine and interpret meaningful values of the variables from a graph of a real-world quadratic relation, like profit versus number of items produced.
- What a, h, and k do to a parabola's graphmbf3c.1.3 — Investigate the roles of a, h, and k in y = a(x - h)² + k, and describe them as translations, reflections, and vertical stretches/compressions of y = x².
- Sketching quadratic graphs from vertex formmbf3c.1.4 — Sketch graphs of quadratic relations given in the form y = a(x - h)² + k, using the vertex and points on each side, or by transforming y = x².
- Expanding and simplifying quadratic expressionsmbf3c.1.5 — Expand and simplify quadratic expressions in one variable, by multiplying two binomials or squaring a binomial, using tools like algebra tiles or computer algebra systems.
- Converting vertex form to standard formmbf3c.1.6 — Express a quadratic relation's equation in standard form given its vertex form, and verify with graphing technology that the two forms are equivalent.
- Factoring trinomialsmbf3c.1.7 — Factor trinomials of the form ax² + bx + c, where a = 1 or a is a common factor, using various methods.
- Connecting factors to the graph's x-interceptsmbf3c.1.8 — Investigate and describe the connection between the factors of a quadratic expression and the x-intercepts of the corresponding graph.
- Solving real-world quadratic problems by factoring or graphingmbf3c.1.9 — Solve problems using factoring or graphing, given equations of quadratic relations, including real-world ones like a break-even point.
Understanding Exponents and Exponential Relations
- What negative exponents and zero as an exponent meanmbf3c.1.10 — Investigate, using graphing and patterns in tables of values, and describe what negative exponents and zero as an exponent mean.
- Evaluating expressions with integer exponents and rational basesmbf3c.1.11 — Evaluate, with and without technology, numeric expressions containing integer exponents and rational bases.
- Exponent rules for multiplying, dividing, and powers of powersmbf3c.1.12 — Investigate, through patterning, the exponent rules for multiplying and dividing numerical expressions with exponents and for a power of a power.
- Graphing simple exponential relations by handmbf3c.1.13 — Graph simple exponential relations by hand, using paper and pencil, given their equations.
- Connecting numeric, graphical, and algebraic exponential representationsmbf3c.1.14 — Make and describe connections between numeric (table of values), graphical, and algebraic representations of an exponential relation.
- Telling exponential relations apart from linear and quadratic onesmbf3c.1.15 — Distinguish exponential relations from linear and quadratic relations by comparing rates of change, graphs, and equations within the same context.
Solving Problems Involving Exponential Relations
- Collecting and graphing data that fits an exponential modelmbf3c.1.16 — Collect data that can be modelled as an exponential relation, from primary or secondary sources, and graph the data.
- Describing characteristics of real-world exponential relationsmbf3c.1.17 — Describe characteristics of exponential relations from real-world applications, like bacterial growth, using tables of values and graphs.
- Posing and solving problems using exponential graphsmbf3c.1.18 — Pose problems involving exponential relations from real-world applications, and solve them using a given or generated graph from a table of values or equation.
- Solving problems using exponential equationsmbf3c.1.19 — Solve problems using given equations of exponential relations from real-world applications by substituting values for the exponent.
The official wording — 19 outcomes in this unit
- mbf3c.1.1
construct tables of values and graph quadra- tic relations arising from real-world applica- tions
- mbf3c.1.2
determine and interpret meaningful values of the variables, given a graph of a quadratic relation arising from a real-world application
- mbf3c.1.3
determine, through investigation using technology, the roles of a, h, and k in quadratic relations of the form y = a(x – h) + k
- mbf3c.1.4
sketch graphs of quadratic relations repre- sented by the equation y = a(x – h) + k
- mbf3c.1.5
expand and simplify quadratic expressions in one variable involving multiplying binomials
- mbf3c.1.6
express the equation of a quadratic relation in the standard form y = ax + bx + c, given the vertex form y = a(x – h) + k, and verify, using graphing technology, that these forms are equivalent representations
- mbf3c.1.7
factor trinomials of the form ax + bx + c, where a = 1 or where a is the common factor, by various methods
- mbf3c.1.8
determine, through investigation, and describe the connection between the factors of a quadratic expression and the x-intercepts of the graph of the corresponding quadratic relation
- mbf3c.1.9
solve problems, using an appropriate strategy (i.e., factoring, graphing), given equations of quadratic relations, including those that arise from real-world applications
- mbf3c.1.10
determine, through investigation using a variety of tools and strategies (e.g., graphing with technology; looking for patterns in tables of values), and describe the meaning of nega- tive exponents and of zero as an exponent
- mbf3c.1.11
evaluate, with and without technology, numeric expressions containing integer exponents and rational bases
- mbf3c.1.12
determine, through investigation (e.g., by patterning with and without a calculator), the exponent rules for multiplying and dividing numerical expressions involving exponents
- mbf3c.1.13
graph simple exponential relations, using paper and pencil, given their equations
- mbf3c.1.14
make and describe connections between representations of an exponential relation
- mbf3c.1.15
distinguish exponential relations from linear and quadratic relations by making compar- isons in a variety of ways
- mbf3c.1.16
collect data that can be modelled as an exponential relation, through investigation with and without technology, from primary sources
- mbf3c.1.17
describe some characteristics of exponential relations arising from real-world applications
- mbf3c.1.18
pose problems involving exponential relations arising from a variety of real-world applica- tions
- mbf3c.1.19
solve problems using given equations of exponential relations arising from a variety of real-world applications
Unit 2Personal FinanceOfficial strand · Strand B
Compound interest and its link to exponential growth; comparing financial services and credit costs; and the costs of owning and operating a vehicle.
Solving Problems Involving Compound Interest
- Compound interest as repeated simple interestmbf3c.2.1 — Investigate compound interest using repeated calculations of simple interest, and compare, with tables and graphs, simple and compound interest for a given principal and rate.
- The link between compound interest and exponential growthmbf3c.2.2 — Investigate, using spreadsheets and graphs, and describe the relationship between compound interest and exponential growth.
- Using the compound interest formula to find amount or principalmbf3c.2.3 — Solve problems, using a scientific calculator, that involve calculating the amount (future value) or principal (present value) using A = P(1 + i)ⁿ.
- Calculating total interest earned or paidmbf3c.2.4 — Calculate the total interest earned on an investment or paid on a loan using I = A - P.
- Using the TVM Solver to find interest rate or number of periodsmbf3c.2.5 — Solve problems, using a TVM Solver, that involve calculating the interest rate per compounding period or the number of compounding periods.
- How changing time, rate, or period affects an investment or loanmbf3c.2.6 — Investigate, using technology, the effect on future value of changing the length of time, interest rate, or compounding period of a compound interest investment or loan.
Comparing Financial Services
- Comparing savings alternatives and their costsmbf3c.2.7 — Gather, interpret, and compare information about savings alternatives available from financial institutions, their costs, and ways to reduce those costs.
- Comparing investment alternatives by risk and returnmbf3c.2.8 — Gather and interpret information about investment alternatives, like stocks, mutual funds, and GICs, and compare them by risk and rate of return.
- Comparing costs and incentives of credit and debit cardsmbf3c.2.9 — Gather, interpret, and compare information about the costs and incentives associated with various credit cards and debit cards.
- Credit card interest rates and the effect of delayed paymentsmbf3c.2.10 — Gather, interpret, and compare current credit card interest rates and regulations, and investigate the effects of delayed payments on a credit card balance.
- Applying the compound interest formula to purchases on creditmbf3c.2.11 — Solve problems involving applications of the compound interest formula to determine the cost of making a purchase on credit.
Owning and Operating a Vehicle
- Comparing vehicle insurance costsmbf3c.2.12 — Gather and interpret information about the procedures and costs of insuring a vehicle, and compare insurance costs across categories of drivers and vehicles.
- Comparing the costs of buying versus leasing a vehiclembf3c.2.13 — Gather, interpret, and compare information about the costs of buying or leasing a new vehicle or buying a used one.
- Solving problems with fixed and variable vehicle costsmbf3c.2.14 — Solve problems, using technology, that involve the fixed costs and variable costs of owning and operating a vehicle.
The official wording — 14 outcomes in this unit
- mbf3c.2.1
determine, through investigation using technol- ogy, the compound interest for a given invest- ment, using repeated calculations of simple interest
- mbf3c.2.2
determine, through investigation (e.g., using spreadsheets and graphs), and describe the relationship between compound interest and exponential growth
- mbf3c.2.3
solve problems, using a scientific calculator, that involve the calculation of the amount, A
- mbf3c.2.4
calculate the total interest earned on an invest- ment or paid on a loan by determining the difference between the amount and the princi- pal
- mbf3c.2.5
solve problems, using a TVM Solver on a graphing calculator or on a website, that involve the calculation of the interest rate per compounding period, i, or the number of com- pounding periods, n
- mbf3c.2.6
determine, through investigation using technology (e.g., a TVM Solver on a graphing calculator or on a website), the effect on the future value of a compound interest invest- ment or loan of changing the total length of time, the interest rate, or the compounding period
- mbf3c.2.7
gather, interpret, and compare information about the various savings alternatives com- monly available from financial institutions
- mbf3c.2.8
gather and interpret information about invest- ment alternatives
- mbf3c.2.9
gather, interpret, and compare information about the costs (e.g., user fees, annual fees, service charges, interest charges on overdue balances) and incentives
- mbf3c.2.10
gather, interpret, and compare information about current credit card interest rates and regulations, and determine, through investi- gation using technology, the effects of delayed payments on a credit card balance
- mbf3c.2.11
solve problems involving applications of the compound interest formula to determine the cost of making a purchase on credit
- mbf3c.2.12
gather and interpret information about the procedures and costs involved in insuring a vehicle (e.g., car, motorcycle, snowmobile) and the factors affecting insurance rates
- mbf3c.2.13
gather, interpret, and compare information about the procedures and costs (e.g., monthly payments, insurance, depreciation, mainte- nance, miscellaneous expenses) involved in buying or leasing a new vehicle or buying a used vehicle
- mbf3c.2.14
solve problems, using technology (e.g., calcu- lator, spreadsheet), that involve the fixed costs (e.g., licence fee, insurance) and variable costs (e.g., maintenance, fuel) of owning and oper- ating a vehicle
Unit 3Geometry and TrigonometryOfficial strand · Strand C
Representing real-world 2D shapes and 3D objects, solving design problems, and using the primary trig ratios and the sine and cosine laws in acute triangles.
Representing Two-Dimensional Shapes and Three-Dimensional Figures
- Recognizing real-world applications of geometric shapesmbf3c.3.1 — Recognize and describe real-world applications of geometric shapes and figures in contexts like product design, architecture, and fashion, and explain why those shapes are used.
- Representing 3D objects with drawing tools and softwarembf3c.3.2 — Represent three-dimensional objects using concrete materials and design or drawing software, in ways like orthographic projections, isometric drawings, or scale models.
- Creating nets, plans, and patterns from physical modelsmbf3c.3.3 — Create nets, plans, and patterns from physical models arising from real-world applications like fashion design or building construction, using metric and imperial systems.
- Solving design problems with given constraintsmbf3c.3.4 — Solve design problems that satisfy given constraints, using physical models or drawings, and state any assumptions made.
Applying the Sine Law and the Cosine Law in Acute Triangles
- Solving right-triangle problems with primary trig ratiosmbf3c.3.5 — Solve real-world problems, including surveying and navigation, by finding the sides and angles of right triangles using the primary trigonometric ratios.
- Verifying the sine law and the cosine lawmbf3c.3.6 — Verify the sine law and the cosine law through investigation using dynamic geometry software or a spreadsheet.
- Choosing between the sine law and the cosine lawmbf3c.3.7 — Describe the conditions that guide when to use the sine law or cosine law, and use these laws to calculate sides and angles in acute triangles.
- Solving real-world triangle problems with metric and imperial measurementsmbf3c.3.8 — Solve real-world problems involving metric and imperial measurements that require the sine law or cosine law in acute triangles.
The official wording — 8 outcomes in this unit
- mbf3c.3.1
recognize and describe real-world applications of geometric shapes and figures, through investigation
- mbf3c.3.2
represent three-dimensional objects, using concrete materials and design or drawing software, in a variety of ways
- mbf3c.3.3
create nets, plans, and patterns from physical models arising from a variety of real-world applications
- mbf3c.3.4
solve design problems that satisfy given con- straints (e.g., design a rectangular berm that would contain all the oil that could leak from a cylindrical storage tank of a given height and radius), using physical models
- mbf3c.3.5
solve problems, including those that arise from real-world applications (e.g., surveying, navigation), by determining the measures of the sides and angles of right triangles using the primary trigonometric ratios
- mbf3c.3.6
verify, through investigation using technology (e.g., dynamic geometry software, spread- sheet), the sine law and the cosine law
- mbf3c.3.7
describe conditions that guide when it is appropriate to use the sine law or the cosine law, and use these laws to calculate sides and angles in acute triangles
- mbf3c.3.8
solve problems that arise from real-world applications involving metric and imperial measurements and that require the use of the sine law or the cosine law in acute triangles
Unit 4Data ManagementOfficial strand · Strand D
Designing, collecting, and organizing one-variable data; measures of central tendency and spread; and probability, including theoretical and experimental probability.
Working With One-Variable Data
- Designing questionnaires and experiments for one-variable datambf3c.4.1 — Identify situations involving one-variable data, and design questionnaires or experiments to gather it, considering ethics, privacy, and possible bias.
- Collecting one-variable data from secondary sourcesmbf3c.4.2 — Collect one-variable data from secondary sources, and organize and store the data using tools like spreadsheets or dynamic statistical software.
- Population versus sample and why sampling is necessarymbf3c.4.3 — Explain the distinction between population and sample, describe a good sample's characteristics, and explain why sampling is necessary.
- Sampling techniques and collecting primary datambf3c.4.4 — Describe and compare sampling techniques, collect one-variable data from primary sources using appropriate sampling techniques, and organize and store the data.
- Types of one-variable data and graphical formsmbf3c.4.5 — Identify categorical, discrete, and continuous one-variable data, and represent the data in appropriate graphical forms like histograms and circle graphs.
- Properties of common data distributionsmbf3c.4.6 — Identify and describe properties associated with common distributions of data, like normal, bimodal, and skewed.
Measures of Central Tendency and Spread
- Calculating measures of central tendency and spreadmbf3c.4.7 — Calculate and interpret measures of central tendency (mean, median, mode) and measures of spread (range, standard deviation) using formulas and/or technology.
- Choosing the appropriate measure of central tendency or spreadmbf3c.4.8 — Explain the appropriate use of measures of central tendency and measures of spread for a given data set.
- Comparing two or more data sets using central tendency and spreadmbf3c.4.9.a — Compare two or more sets of one-variable data using measures of central tendency and measures of spread.
- Solving problems by interpreting and analysing secondary-source datambf3c.4.9.b — Solve problems by interpreting and analysing one-variable data collected from secondary sources, such as published statistics or online datasets.
Applying Probability
- Identifying probability in the media and its representationsmbf3c.4.10 — Identify examples of probability used in the media and the ways probability is represented, like as a fraction, percent, or decimal.
- Determining theoretical probabilitymbf3c.4.11 — Determine the theoretical probability of an event, and represent the probability in a variety of ways.
- Determining experimental probabilitymbf3c.4.12 — Perform a probability experiment, represent the results with a frequency distribution, and use it to determine experimental probability.
- Comparing theoretical and experimental probabilitymbf3c.4.13 — Compare, through investigation, theoretical probability with experimental probability, and explain why they might differ.
- How experimental probability approaches theoretical probability with more trialsmbf3c.4.14 — Investigate, using simulations, how experimental probability tends to approach theoretical probability as the number of trials increases.
- Connecting probability and statistics in the mediambf3c.4.15 — Interpret information involving probability and statistics in the media, and make connections between probability and statistics.
The official wording — 16 outcomes in this unit
- mbf3c.4.1
identify situations involving one-variable data (i.e., data about the frequency of a given occurrence), and design questionnaires
- mbf3c.4.2
collect one-variable data from secondary sources (e.g., Internet databases), and organ- ize and store the data using a variety of tools
- mbf3c.4.3
explain the distinction between the terms population and sample, describe the charac- teristics of a good sample, and explain why sampling is necessary
- mbf3c.4.4
describe and compare sampling techniques (e.g., random, stratified, clustered, conven- ience, voluntary); collect one-variable data from primary sources
- mbf3c.4.5
identify different types of one-variable data (i.e., categorical, discrete, continuous), and represent the data, with and without techno- logy, in appropriate graphical forms
- mbf3c.4.6
identify and describe properties associated with common distributions of data
- mbf3c.4.7
calculate, using formulas and/or technology (e.g., dynamic statistical software, spread- sheet, graphing calculator), and interpret measures of central tendency
- mbf3c.4.8
explain the appropriate use of measures of central tendency (i.e., mean, median, mode) and measures of spread (i.e., range, standard deviation)
- mbf3c.4.9.a
compare two or more sets of one-variable data, using measures of central tendency and measures of spread
- mbf3c.4.9.b
solve problems by interpreting and analysing one-variable data collected from secondary sources
- mbf3c.4.10
identify examples of the use of probability in the media and various ways in which proba- bility is represented
- mbf3c.4.11
determine the theoretical probability of an event (i.e., the ratio of the number of favourable outcomes to the total number of possible outcomes, where all outcomes are equally likely)
- mbf3c.4.12
perform a probability experiment (e.g., toss- ing a coin several times), represent the results using a frequency distribution, and use the distribution to determine the experimental probability of an event
- mbf3c.4.13
compare, through investigation, the theoreti- cal probability of an event with the experi- mental probability, and explain why they might differ
- mbf3c.4.14
determine, through investigation using class- generated data and technology-based simula- tion models
- mbf3c.4.15
interpret information involving the use of probability and statistics in the media, and make connections between probability and statistics
Printable workbook · A keepsake of the year
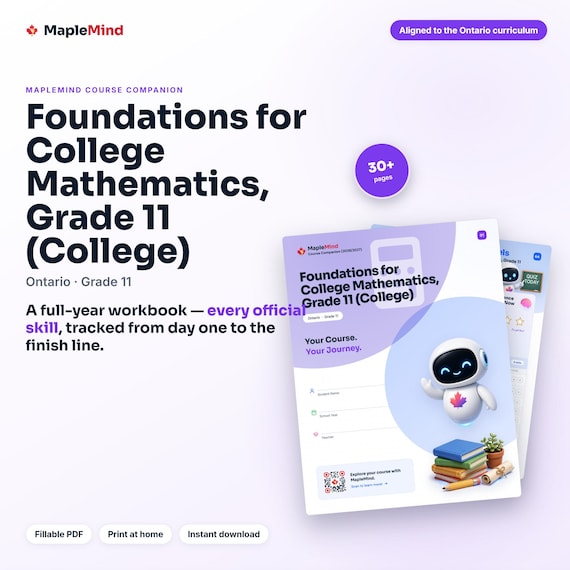
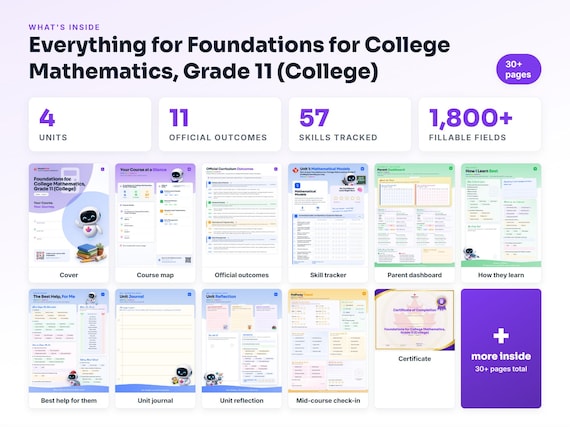
A Foundations for College Mathematics, Grade 11 (College) workbook worth keeping
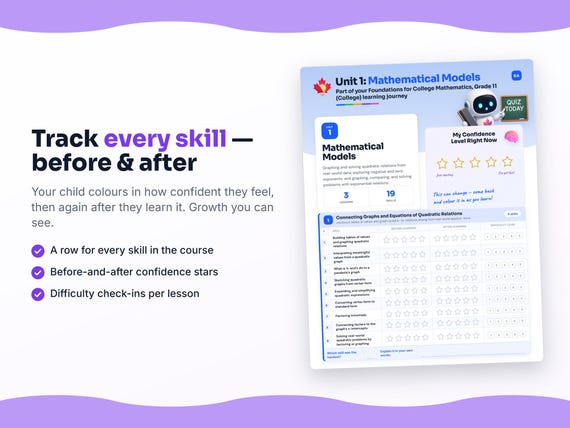
Built from the same official curriculum as this page. Before and after each skill above, your student colours in how sure they feel — so the two of you can see, on one page, what's clicking and what needs another look. It's a quiet way to follow how the year is really going.
By June it's full of their own handwriting: units worked through, confidence grown, a mid-year check-in, notes from parent-teacher night, and a certificate at the end. Less a worksheet, more a record of the year worth keeping on the shelf.
Instant download · see every page, reviews and the full description · five or more workbooks are $2.99 each
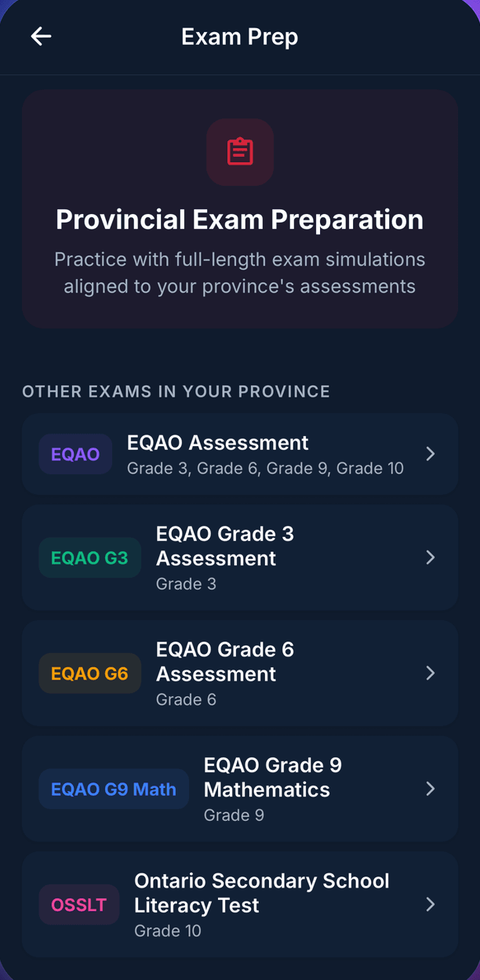
What it looks like in the app


Common questions
Can MapleMind help me with Foundations for College Mathematics, Grade 11 (College)?
Yes. MapleMind's AI tutor covers all 57 skills in Ontario's Foundations for College Mathematics, Grade 11 (College) — you pick the exact skill, and the tutor teaches it step by step: a short lesson, a worked example, solving together, then a skill check to show it stuck.
Is MapleMind aligned to Ontario's official curriculum?
Yes. Every skill in this course maps to an official outcome code from Ontario's Grade 11 Mathematics curriculum, and the ministry's own wording is quoted under each unit on this page — with the official government source linked so you can check it yourself.
What does MapleMind cost?
It's free to start — 5 tutoring chats and a practice quiz every day, no credit card. A Pro subscription ($9.99/month or $49.99/year CAD, 7-day free trial) unlocks unlimited tutoring, practice, and exam simulations.
What if I'm stuck on just one topic?
That's the point of skill-level tutoring: open Foundations for College Mathematics, Grade 11 (College) in the app, tap the exact skill from the list on this page, and the tutor teaches just that — no wading through lessons you don't need.
Does MapleMind work in French or other languages?
Yes — 14 languages, including French. Both the app and the tutor's explanations switch to the language you choose.
Where can I see the official Ontario curriculum for Foundations for College Mathematics, Grade 11 (College)?
The official source is linked on this page — Ontario's official mathematics curriculum. The outline here follows it: every MapleMind skill carries its official outcome code, and the ministry's own wording is quoted under each unit.
Keep exploring
Ready when you are
Pick a skill from this page and see it taught properly — free, in the browser, in under a minute.