Get help with Mathematics of Data Management, Grade 12 (University)
Most tutoring makes you sit through material you already know. MapleMind flips that: pick the exact skill that's causing trouble — any of the 57 below — and the tutor teaches just that one, step by step, as many times as it takes. Ask questions in plain words, any time of day, in English, French, or 12 other languages.
The official Ontario Mathematics of Data Management, Grade 12 (University) curriculum
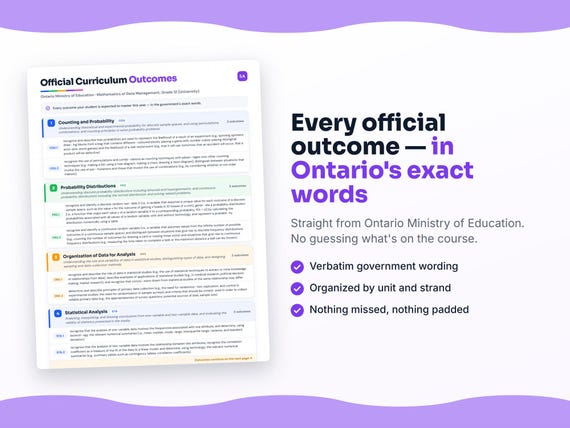
Ontario defines Mathematics of Data Management, Grade 12 (University) by strands and outcomes. MapleMind teaches the same curriculum reorganized for one-skill-at-a-time tutoring — the table shows exactly where every official strand lands, and the ministry's own wording is quoted under each unit below.
Official source Ontario's official mathematics curriculumRead it on the government site — dcp.edu.gov.on.ca ↗| Official strand | Outcomes | Where MapleMind teaches it |
|---|---|---|
| Strand 1 | 12 | Counting and Probability |
| Strand 2 | 15 | Probability Distributions |
| Strand 3 | 8 | Organization of Data for Analysis |
| Strand 4 | 13 | Statistical Analysis |
| Strand 5 | 9 | Culminating Data Management Investigation |
Every skill below, taught one on one.
 Try the first session free
How MapleMind teaches Mathematics of Data Management, Grade 12 (University) — every unit, lesson, and skill
Every skill below runs as a short session: a plain-words lesson, a worked example, solving it together, then a five-question skill check that earns up to three stars. Guided Mode keeps it teaching instead of answer-handing — turning it off needs a parent's password.
Unit 1Counting and ProbabilityOfficial strand · Strand 1
Understanding theoretical and experimental probability for discrete sample spaces, and using permutations, combinations, and counting principles to solve probability problems.
Solving Probability Problems Involving Discrete Sample Spaces
- Probabilities represent the likelihood of a resultmdm4u.1.1 — Recognize and describe how probabilities are used to represent the likelihood of a result of an experiment and of a real-world event.
- Discrete versus continuous sample spacesmdm4u.1.2 — Describe a sample space as a set containing all possible outcomes of an experiment, and distinguish a discrete sample space (outcomes can be counted) from a continuous one (outcomes can be measured).
- Theoretical probability and the probability distribution summing to 1mdm4u.1.3 — Determine the theoretical probability of each outcome of a discrete sample space, recognize that the probabilities sum to 1 and form the probability distribution, and solve related problems.
- Experimental probability approaching theoretical probabilitymdm4u.1.4 — Determine, through investigation using class-generated data and technology-based simulation, that experimental probability approaches theoretical probability as the number of trials increases.
- Complements and mutually exclusive eventsmdm4u.1.5 — Recognize and describe an event as a subset of a sample space, determine the complement of an event, determine whether events are mutually exclusive, and solve related probability problems.
- Independent, dependent, and conditional eventsmdm4u.1.6 — Determine whether two events are independent or dependent, and whether one is conditional on another, and solve related probability problems.
Solving Problems Using Counting Principles
- Permutations vs. combinations: when order mattersmdm4u.1.7.a — Recognize permutations and combinations as counting techniques with advantages over other methods, and distinguish situations that involve permutations from those involving combinations by considering whether order matters.
- Calculating permutations and combinations and connecting themmdm4u.1.7.b — Make connections between, and calculate, permutations and combinations.
- Solving counting problems with standard combinatorial notationmdm4u.1.8 — Solve simple problems using techniques for counting permutations and combinations, where all objects are distinct, and express solutions using standard combinatorial notation.
- The additive and multiplicative counting principlesmdm4u.1.9 — Solve introductory counting problems involving the additive counting principle and the multiplicative counting principle.
- Connecting combinations and Pascal's trianglemdm4u.1.10 — Make connections, through investigation, between combinations and Pascal's triangle.
- Solving probability problems using counting principlesmdm4u.1.11 — Solve probability problems using counting principles for situations involving equally likely outcomes.
The official wording — 12 outcomes in this unit
- mdm4u.1.1
recognize and describe how probabilities are used to represent the likelihood of a result of an experiment (e.g., spinning spinners; draw- ing blocks from a bag that contains different- coloured blocks; playing a game with number cubes; playing Aboriginal stick-and-stone games) and the likelihood of a real-world event (e.g., that it will rain tomorrow, that an accident will occur, that a product will be defective)
- mdm4u.1.2
describe a sample space as a set that contains all possible outcomes of an experiment, and distinguish between a discrete sample space as one whose outcomes can be counted (e.g., all possible outcomes of drawing a card or tossing a coin) and a continuous sample space as one whose outcomes can be measured (e.g., all possible outcomes of the time it takes to complete a task or the maximum distance a ball can be thrown)
- mdm4u.1.3
determine the theoretical probability, P (i.e., a value from 0 to 1), of each outcome of a discrete sample space (e.g., in situations in which all outcomes are equally likely), recognize that the sum of the probabilities of the outcomes is 1 (i.e., for n outcomes, P + P + P + … + P = 1), recognize that the probabilities P form the probability distribu- tion associated with the sample space, and solve related problems
- mdm4u.1.4
determine, through investigation using class- generated data and technology-based simula- tion models (e.g., using a random-number generator on a spreadsheet or on a graphing calculator; using dynamic statistical software to simulate repeated trials in an experiment), the tendency of experimental probability to approach theoretical probability as the num- ber of trials in an experiment increases
- mdm4u.1.5
recognize and describe an event as a set of outcomes and as a subset of a sample space, determine the complement of an event, deter- mine whether two or more events are mutual- ly exclusive or non-mutually exclusive (e.g., the events of getting an even number or getting an odd number of heads from tossing a coin 5 times are mutually exclusive), and solve related probability problems [e.g., cal- culate P(~A), P(A and B), P(A or B)] using a variety of strategies (e.g., Venn diagrams, lists, formulas)
- mdm4u.1.6
determine whether two events are indepen- dent or dependent, and whether one event is conditional on another event, and solve related probability problems [e.g., calculate P(A and B), P(A or B), P(A given B)] using a variety of strategies (e.g., tree diagrams, lists, formulas)
- mdm4u.1.7.a
recognize the use of permutations and combi- nations as counting techniques with advan- tages over other counting techniques (e.g., making a list; using a tree diagram; making a chart; drawing a Venn diagram), distinguish between situations that involve the use of per- mutations and those that involve the use of combinations (e.g., by considering whether or not order matters)
- mdm4u.1.7.b
and make connections between, and calculate, permutations and combinations Sample problem: An organization with 10 members is considering two leadership models. One involves a steering committee with 4 members of equal standing. The other is an executive committee consisting of a president, vice-president, secretary, and treasurer. Determine the number of ways of selecting the executive committee from the 10 members and, using this number, the number of ways of selecting the steering committee from the 10 members.
- mdm4u.1.8
solve simple problems using techniques for counting permutations and combinations, where all objects are distinct, and express the solutions using standard combinatorial notation [e.g., n!, P(n, r), ( )]
- mdm4u.1.9
solve introductory counting problems involv- ing the additive counting principle (e.g., determining the number of ways of selecting 2 boys or 2 girls from a group of 4 boys and 5 girls) and the multiplicative counting princi- ple (e.g., determining the number of ways of selecting 2 boys and 2 girls from a group of 4 boys and 5 girls)
- mdm4u.1.10
make connections, through investigation, between combinations (i.e., n choose r) and Pascal’s triangle [e.g., between ( )and diagonal 3 of Pascal’s triangle]
- mdm4u.1.11
solve probability problems using counting principles for situations involving equally likely outcomes Sample problem: Two marbles are drawn randomly from a bag containing 12 green marbles and 16 red marbles. What is the probability that the two marbles are both green if the first marble is replaced? If the first marble is not replaced?
Unit 2Probability DistributionsOfficial strand · Strand 2
Understanding discrete probability distributions including binomial and hypergeometric, and continuous probability distributions including the normal distribution, and solving related problems.
Understanding Probability Distributions for Discrete Random Variables
- Discrete random variables and generating a probability distributionmdm4u.2.1 — Recognize and identify a discrete random variable, generate a probability distribution by calculating probabilities for all its values, and represent it numerically using a table.
- Calculating and interpreting expected valuemdm4u.2.2 — Calculate the expected value for a given probability distribution, interpret it in applications, and connect it to the weighted mean of the random variable's values.
- Representing a distribution with a probability histogrammdm4u.2.3 — Represent a probability distribution graphically using a probability histogram, and connect it to the frequency histogram.
- The binomial probability distributionmdm4u.2.4 — Recognize conditions that give rise to a binomial probability distribution, calculate the probability for each value, and represent the distribution numerically and graphically.
- The hypergeometric probability distributionmdm4u.2.5 — Recognize conditions that give rise to a hypergeometric probability distribution, calculate its probabilities, and represent it numerically and graphically.
- Comparing discrete probability distributionsmdm4u.2.6 — Compare, with technology and using numeric and graphical representations, the probability distributions of discrete random variables.
- Solving real-world problems with probability distributionsmdm4u.2.7 — Solve problems involving probability distributions, including problems arising from real-world applications.
Understanding Probability Distributions for Continuous Random Variables
- Continuous random variables and discrete vs. continuous frequency distributionsmdm4u.2.8 — Recognize and identify a continuous random variable, and distinguish situations giving rise to discrete versus continuous frequency distributions.
- Standard deviation as a measure of spreadmdm4u.2.9 — Recognize standard deviation as a measure of the spread of a distribution, and determine the mean and standard deviation of a sample of a continuous random variable.
- Representing continuous data with frequency tables, histograms, and polygonsmdm4u.2.11 — Represent a sample of a continuous random variable numerically with a frequency table and graphically with a frequency histogram and polygon, and compare the polygon's effectiveness for different interval sizes.
- Challenges in determining a continuous frequency distributionmdm4u.2.10 — Describe challenges associated with determining a continuous frequency distribution, and recognize the need for mathematical models to represent them.
- Theoretical probability over a range for a continuous variablemdm4u.2.12 — Recognize that theoretical probability for a continuous random variable is determined over a range of values, that a single value has probability zero, and that ranges form the probability distribution.
- Properties of the normal distributionmdm4u.2.13 — Recognize that the normal distribution is commonly used to model continuous random variables, describe its properties, and recognize situations that can be modelled using it.
- Connecting the normal distribution to binomial and hypergeometric distributionsmdm4u.2.14 — Make connections, through investigation, between the normal distribution and the binomial and hypergeometric distributions for increasing numbers of trials.
- Using z-scores to solve normal distribution problemsmdm4u.2.15 — Recognize a z-score as the number of standard deviations from the mean, and solve probability problems involving normal distributions using a variety of tools and strategies.
The official wording — 15 outcomes in this unit
- mdm4u.2.1
recognize and identify a discrete random vari- able X (i.e., a variable that assumes a unique value for each outcome of a discrete sample space, such as the value x for the outcome of getting x heads in 10 tosses of a coin), gener- ate a probability distribution [i.e., a function that maps each value x of a random variable X to a corresponding probability, P(X = x)] by calculating the probabilities associated with all values of a random variable, with and without technology, and represent a probabil- ity distribution numerically using a table
- mdm4u.2.2
calculate the expected value for a given probability distribution [i.e., using E(X) = ∑ xP(X = x)], interpret the expected value in applications, and make connections between the expected value and the weighted mean of the values of the discrete random variable
- mdm4u.2.3
represent a probability distribution graphical- ly using a probability histogram (i.e., a histo- gram on which each rectangle has a base of width 1, centred on the value of the discrete random variable, and a height equal to the probability associated with the value of the random variable), and make connections between the frequency histogram and the probability histogram (e.g., by comparing their shapes)
- mdm4u.2.4
recognize conditions (e.g., independent trials) that give rise to a random variable that follows a binomial probability distribution, calculate the probability associated with each value of the random variable, represent the distribu- tion numerically using a table and graphically using a probability histogram, and make con- nections to the algebraic representation P(X = x) = ( )p (1 – p)
- mdm4u.2.5
recognize conditions (e.g., dependent trials) that give rise to a random variable that fol- lows a hypergeometric probability distribu- tion, calculate the probability associated with each value of the random variable (e.g., by using a tree diagram; by using combinations), and represent the distribution numerically using a table and graphically using a proba- bility histogram
- mdm4u.2.6
compare, with technology and using numeric and graphical representations, the probability distributions of discrete random variables (e.g., compare binomial distributions with the same probability of success for increasing numbers of trials; compare the shapes of a hypergeometric distribution and a binomial distribution)
- mdm4u.2.7
solve problems involving probability distri- butions (e.g., uniform, binomial, hypergeo- metric), including problems arising from real-world applications
- mdm4u.2.8
recognize and identify a continuous random variable (i.e., a variable that assumes values from the infinite number of possible outcomes in a continuous sample space), and distinguish between situations that give rise to discrete frequency distributions (e.g., counting the number of outcomes for drawing a card or tossing three coins) and situations that give rise to continuous frequency distributions (e.g., measuring the time taken to complete a task or the maximum distance a ball can be thrown)
- mdm4u.2.9
recognize standard deviation as a measure of the spread of a distribution, and determine, with and without technology, the mean and standard deviation of a sample of values of a continuous random variable
- mdm4u.2.11
represent, using intervals, a sample of values of a continuous random variable numerically using a frequency table and graphically using a frequency histogram and a frequency poly- gon, recognize that the frequency polygon approximates the frequency distribution, and determine, through investigation using tech- nology (e.g., dynamic statistical software, graphing calculator), and compare the effec- tiveness of the frequency polygon as an approximation of the frequency distribution for different sizes of the intervals
- mdm4u.2.10
describe challenges associated with determin- ing a continuous frequency distribution (e.g., the inability to capture all values of the vari- able, resulting in a need to sample; uncer- tainties in measured values of the variable), and recognize the need for mathematical models to represent continuous frequency distributions
- mdm4u.2.12
recognize that theoretical probability for a continuous random variable is determined over a range of values (e.g., the probability that the life of a lightbulb is between 90 hours and 115 hours), that the probability that a continuous random variable takes any single value is zero, and that the probabilities of ranges of values form the probability distri- bution associated with the random variable
- mdm4u.2.13
recognize that the normal distribution is commonly used to model the frequency and probability distributions of continuous ran- dom variables, describe some properties of the normal distribution (e.g., the curve has a central peak; the curve is symmetric about the mean; the mean and median are equal; approximately 68% of the data values are within one standard deviation of the mean and approximately 95% of the data values are within two standard deviations of the mean), and recognize and describe situations that can be modelled using the normal distribution
- mdm4u.2.14
make connections, through investigation using dynamic statistical software, between the normal distribution and the binomial and hypergeometric distributions for increasing numbers of trials of the discrete distributions (e.g., recognizing that the shape of the hyper- geometric distribution of the number of males on a 4-person committee selected from a group of people more closely resembles the shape of a normal distribution as the size of the group from which the committee was drawn increases)
- mdm4u.2.15
recognize a z-score as the positive or negative number of standard deviations from the mean to a value of the continuous random variable, and solve probability problems involving normal distributions using a variety of tools and strategies (e.g., calculating a z-score and reading a probability from a table; using tech- nology to determine a probability), including problems arising from real-world applications
Unit 3Organization of Data for AnalysisOfficial strand · Strand 3
Understanding the role and variability of data in statistical studies, distinguishing types of data, and designing sampling and data-collection methods.
Understanding Data Concepts
- The role of data in statistical studiesmdm4u.3.1 — Recognize and describe the role of data in statistical studies, describe applications of statistical studies, and recognize that conclusions from studies of the same relationship may differ.
- Why variability is inherent in data, and one-variable vs. multi-variable situationsmdm4u.3.2 — Recognize and explain reasons why variability is inherent in data, and distinguish between one-variable situations and situations involving more than one variable.
- Distinguishing types of statistical datamdm4u.3.3 — Distinguish different types of statistical data (discrete/continuous, qualitative/quantitative, categorical/numerical, nominal/ordinal, primary/secondary, experimental/observational, microdata/aggregate) and give examples.
Collecting and Organizing Data
- Principles of primary data collectionmdm4u.3.4 — Determine and describe principles of primary data collection and criteria for collecting reliable primary data.
- Population vs. sample, and sampling techniquesmdm4u.3.5 — Explain the distinction between population and sample, describe the characteristics of a good sample, explain why sampling is necessary, and describe sampling techniques.
- How sample bias affects study resultsmdm4u.3.6 — Describe how the use of biased random samples or non-random samples can affect the results of a study.
- Designing effective surveys and experimentsmdm4u.3.7 — Describe characteristics of an effective survey, and design questionnaires or experiments for gathering data.
- Collecting and organizing data from primary and secondary sourcesmdm4u.3.8 — Collect data from primary sources through experimentation or from secondary sources, and organize data with one or more attributes to answer a question or solve a problem.
The official wording — 8 outcomes in this unit
- mdm4u.3.1
recognize and describe the role of data in statistical studies (e.g., the use of statistical techniques to extract or mine knowledge of relationships from data), describe examples of applications of statistical studies (e.g., in medical research, political decision making, market research), and recognize that conclu- sions drawn from statistical studies of the same relationship may differ
- mdm4u.3.2
recognize and explain reasons why variability is inherent in data (e.g., arising from limited accuracy in measurement or from variations in the conditions of an experiment; arising from differences in samples in a survey), and distinguish between situations that involve one variable and situations that involve more than one variable
- mdm4u.3.3
distinguish different types of statistical data (i.e., discrete from continuous, qualitative from quantitative, categorical from numerical, nominal from ordinal, primary from secondary, experimental from observational, microdata from aggregate data) and give examples
- mdm4u.3.4
determine and describe principles of primary data collection (e.g., the need for randomiza- tion, replication, and control in experimental studies; the need for randomization in sample surveys) and criteria that should be consid- ered in order to collect reliable primary data (e.g., the appropriateness of survey questions; potential sources of bias; sample size)
- mdm4u.3.5
explain the distinction between the terms population and sample, describe the character- istics of a good sample, explain why sampling is necessary (e.g., time, cost, or physical con- straints), and describe and compare some sampling techniques (e.g., simple random, systematic, stratified, convenience, voluntary)
- mdm4u.3.6
describe how the use of random samples with a bias (e.g., response bias, measurement bias, non-response bias, sampling bias) or the use of non-random samples can affect the results of a study
- mdm4u.3.7
describe characteristics of an effective survey (e.g., by giving consideration to ethics, priva- cy, the need for honest responses, and possi- ble sources of bias, including cultural bias), and design questionnaires (e.g., for determin- ing if there is a relationship between a person’s age and their hours per week of Internet use, between marks and hours of study, or between income and years of education) or experiments (e.g., growth of plants under different condi- tions) for gathering data
- mdm4u.3.8
collect data from primary sources, through experimentation, or from secondary sources (e.g., by using the Internet to access reliable data from a well-organized database such as E-STAT; by using print sources such as news- papers and magazines), and organize data with one or more attributes (e.g., organize data about a music collection classified by artist, date of recording, and type of music using dynamic statistical software or a spreadsheet) to answer a question or solve a problem
Unit 4Statistical AnalysisOfficial strand · Strand 4
Analysing, interpreting, and drawing conclusions from one-variable and two-variable data, and evaluating the validity of statistics presented in the media.
Analysing One-Variable Data
- Numerical summaries of one-variable datamdm4u.4.1 — Recognize that analysis of one-variable data involves the frequencies of one attribute, and determine relevant numerical summaries such as mean, median, mode, range, interquartile range, variance, and standard deviation.
- Positions within a data set using quartiles, percentiles, and z-scoresmdm4u.4.2 — Determine the positions of individual data points using quartiles, percentiles, and z-scores, and use the normal distribution to model suitable one-variable data sets.
- Graphical summaries of one-variable datamdm4u.4.3 — Generate, using technology, the relevant graphical summaries of one-variable data based on the type of data provided.
- Margin of error and confidence levelmdm4u.4.4 — Interpret the meaning of a statistic qualified by margin of error and confidence level, and connect sample size, margin of error, and confidence level.
- Interpreting, comparing, and concluding from one-variable statistical summariesmdm4u.4.5 — Interpret statistical summaries to describe and compare one-variable data sets, describe how summaries can misrepresent data, and make and justify conclusions using convincing arguments.
Analysing Two-Variable Data
- Two-variable data, correlation coefficient, and numerical summariesmdm4u.4.6 — Recognize that two-variable analysis involves the relationship between two attributes, recognize the correlation coefficient as a measure of fit to a linear model, and determine relevant numerical summaries.
- Types of relationships between two variablesmdm4u.4.7 — Recognize and distinguish different types of relationships between two variables that have a mathematical correlation: cause-and-effect, common-cause, and accidental.
- Graphical summaries of two-variable datamdm4u.4.8 — Generate, using technology, the relevant graphical summaries of two-variable data based on the type of data provided.
- Linear regression and the fit of an individual data pointmdm4u.4.9 — Determine, by performing linear regression using technology, the equation of a line that models a two-variable data set, and determine the fit of an individual data point.
- Interpreting, comparing, and concluding from two-variable statistical summariesmdm4u.4.10 — Interpret statistical summaries to describe and compare two-variable data sets, describe how summaries can misrepresent data, and make and justify conclusions using convincing arguments.
Evaluating Validity
- How the media and advertising use and misuse statisticsmdm4u.4.11 — Interpret statistics presented in the media, and explain how the media, advertising industry, and others use and misuse statistics to promote a certain point of view.
- Assessing the validity of conclusions presented in the mediamdm4u.4.12 — Assess the validity of conclusions presented in the media by examining sources, methods of collection, possible sources of bias, and the analysis and conclusions drawn.
- Applications of data management in occupations and university programsmdm4u.4.13 — Gather, interpret, and describe information about applications of data management in occupations and about university programs that explore these applications.
The official wording — 13 outcomes in this unit
- mdm4u.4.1
recognize that the analysis of one-variable data involves the frequencies associated with one attribute, and determine, using technol- ogy, the relevant numerical summaries (i.e., mean, median, mode, range, interquartile range, variance, and standard deviation)
- mdm4u.4.2
determine the positions of individual data points within a one-variable data set using quartiles, percentiles, and z-scores, use the normal distribution to model suitable one- variable data sets, and recognize these processes as strategies for one-variable data analysis
- mdm4u.4.3
generate, using technology, the relevant graphical summaries of one-variable data (e.g., circle graphs, bar graphs, histograms, stem-and-leaf plots, boxplots) based on the type of data provided (e.g., categorical, ordinal, quantitative)
- mdm4u.4.4
interpret, for a normally distributed popula- tion, the meaning of a statistic qualified by a statement describing the margin of error and the confidence level (e.g., the meaning of a statistic that is accurate to within 3 percentage points, 19 times out of 20), and make connec- tions, through investigation using technology (e.g., dynamic statistical software), between the sample size, the margin of error, and the confidence level (e.g., larger sample sizes create higher confidence levels for a given margin of error)
- mdm4u.4.5
interpret statistical summaries (e.g., graphical, numerical) to describe the characteristics of a one-variable data set and to compare two related one-variable data sets (e.g., compare the lengths of different species of trout; compare annual incomes in Canada and in a third-world country; compare Aboriginal and non-Aboriginal incomes); describe how statis- tical summaries (e.g., graphs, measures of central tendency) can be used to misrepresent one-variable data; and make inferences, and make and justify conclusions, from statistical summaries of one-variable data orally and in writing, using convincing arguments
- mdm4u.4.6
recognize that the analysis of two-variable data involves the relationship between two attributes, recognize the correlation coefficient as a measure of the fit of the data to a linear model, and determine, using technology, the relevant numerical summaries (e.g., summary tables such as contingency tables; correlation coefficients)
- mdm4u.4.7
recognize and distinguish different types of relationships between two variables that have a mathematical correlation (e.g., the cause- and-effect relationship between the age of a tree and its diameter; the common-cause rela- tionship between ice cream sales and forest fires over the course of a year; the accidental relationship between the consumer price index and the number of known planets in the universe)
- mdm4u.4.8
generate, using technology, the relevant graphical summaries of two-variable data (e.g., scatter plots, side-by-side boxplots) based on the type of data provided (e.g., categorical, ordinal, quantitative)
- mdm4u.4.9
determine, by performing a linear regression using technology, the equation of a line that models a suitable two-variable data set, deter- mine the fit of an individual data point to the linear model (e.g., by using residuals to iden- tify outliers), and recognize these processes as strategies for two-variable data analysis
- mdm4u.4.10
interpret statistical summaries (e.g., scatter plot, equation representing a relationship) to describe the characteristics of a two- variable data set and to compare two related two-variable data sets (e.g., compare the relationship between Grade 12 English and mathematics marks with the relationship between Grade 12 science and mathematics marks); describe how statistical summaries (e.g., graphs, linear models) can be used to misrepresent two-variable data; and make inferences, and make and justify conclusions, from statistical summaries of two-variable data orally and in writing, using convincing arguments
- mdm4u.4.11
interpret statistics presented in the media (e.g., the UN’s finding that 2% of the world’s population has more than half the world’s wealth, whereas half the world’s population has only 1% of the world’s wealth), and explain how the media, the advertising indus- try, and others (e.g., marketers, pollsters) use and misuse statistics (e.g., as represented in graphs) to promote a certain point of view
- mdm4u.4.12
assess the validity of conclusions presented in the media by examining sources of data, including Internet sources (i.e., to determine whether they are authoritative, reliable, unbiased, and current), methods of data collection, and possible sources of bias (e.g., sampling bias, non-response bias, cultural bias in a survey question), and by questioning the analysis of the data (e.g., whether there is any indication of the sample size in the analysis) and conclusions drawn from the data (e.g., whether any assumptions are made about cause and effect)
- mdm4u.4.13
gather, interpret, and describe information about applications of data management in occupations (e.g., actuary, statistician, busi- ness analyst, sociologist, medical doctor, psychologist, teacher, community planner), and about university programs that explore these applications
Unit 5Culminating Data Management InvestigationOfficial strand · Strand 5
A staged capstone research investigation — posing a problem, planning, gathering data, analysing, concluding, reporting, presenting, and responding to critique — that draws together everything learned in the course.
Designing and Carrying Out a Culminating Investigation
- Stage 1 — Posing a significant problem and doing background researchmdm4u.5.1 — Pose a significant problem of interest that requires organizing and analysing a suitable set of primary or secondary quantitative data, and conduct appropriate background research on the topic.
- Stage 2 — Designing a plan to study the problemmdm4u.5.2 — Design a plan to study the problem, identifying variables and population, developing an ethical survey, establishing procedures, and considering sample size and possible bias.
- Stage 3 — Gathering and organizing investigation datamdm4u.5.3 — Gather data related to the study of the problem and organize the data, with or without technology.
- Stage 4 — Interpreting, analysing, and summarizing the datamdm4u.5.4 — Interpret, analyse, and summarize data related to the study of the problem, generating statistical summaries and applying probability distribution models as needed.
- Stage 5 — Drawing conclusions and evaluating the strength of the evidencemdm4u.5.5 — Draw conclusions from the data analysis, evaluate the strength of the evidence, specify limitations of the conclusions, and suggest follow-up problems or investigations.
- Stage 6 — Compiling a clear, well-organized, detailed reportmdm4u.5.6 — Compile a clear, well-organized, and detailed report of the investigation.
Presenting and Critiquing the Culminating Investigation
- Stage 7 — Presenting the investigation summary to peersmdm4u.5.7 — Present a summary of the culminating investigation to an audience of peers within a specified length of time, with or without technology.
- Stage 8 — Answering questions and responding to critiquesmdm4u.5.8 — Answer questions about the culminating investigation and respond to critiques, by elaborating on procedures and justifying mathematical reasoning.
- Stage 9 — Critiquing the mathematical work of others constructivelymdm4u.5.9 — Critique the mathematical work of others in a constructive manner.
The official wording — 9 outcomes in this unit
- mdm4u.5.1
pose a significant problem of interest that requires the organization and analysis of a suitable set of primary or secondary quantita- tive data (e.g., primary data collected from a student-designed game of chance, secondary data from a reliable source such as E-STAT), and conduct appropriate background research related to the topic being studied
- mdm4u.5.2
design a plan to study the problem (e.g., iden- tify the variables and the population; develop an ethical survey; establish the procedures for gathering, summarizing, and analysing the primary or secondary data; consider the sam- ple size and possible sources of bias)
- mdm4u.5.3
gather data related to the study of the problem (e.g., by using a survey; by using the Internet; by using a simulation) and organize the data (e.g., by setting up a database; by establishing intervals), with or without technology
- mdm4u.5.4
interpret, analyse, and summarize data related to the study of the problem (e.g., generate and interpret numerical and graphical statistical summaries; recognize and apply a probability distribution model; calculate the expected value of a probability distribution), with or without technology
- mdm4u.5.5
draw conclusions from the analysis of the data (e.g., determine whether the analysis solves the problem), evaluate the strength of the evidence (e.g., by considering factors such as sample size or bias, or the number of times a game is played), specify any limitations of the conclusions, and suggest follow-up pro- blems or investigations
- mdm4u.5.6
compile a clear, well-organized, and detailed report of the investigation
- mdm4u.5.7
present a summary of the culminating investi- gation to an audience of their peers within a specified length of time, with technology (e.g. presentation software) or without technology
- mdm4u.5.8
answer questions about the culminating inves- tigation and respond to critiques (e.g., by elaborating on the procedures; by justifying mathematical reasoning)
- mdm4u.5.9
critique the mathematical work of others in a constructive manner


Printable workbook · A keepsake of the year
A Mathematics of Data Management, Grade 12 (University) workbook worth keeping
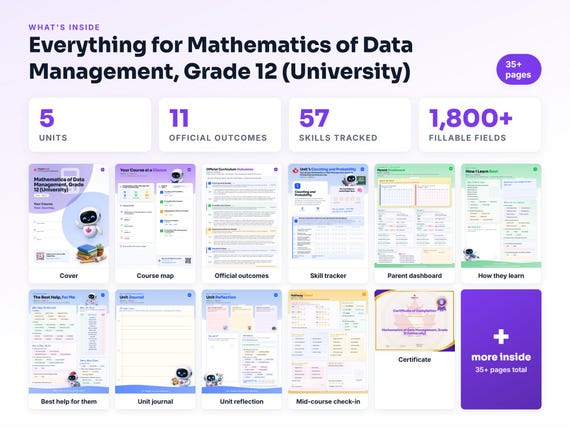
Built from the same official curriculum as this page. Before and after each skill above, your student colours in how sure they feel — so the two of you can see, on one page, what's clicking and what needs another look. It's a quiet way to follow how the year is really going.
By June it's full of their own handwriting: units worked through, confidence grown, a mid-year check-in, notes from parent-teacher night, and a certificate at the end. Less a worksheet, more a record of the year worth keeping on the shelf.
Instant download · see every page, reviews and the full description · five or more workbooks are $2.99 each
What it looks like in the app


Common questions
Can MapleMind help me with Mathematics of Data Management, Grade 12 (University)?
Yes. MapleMind's AI tutor covers all 57 skills in Ontario's Mathematics of Data Management, Grade 12 (University) — you pick the exact skill, and the tutor teaches it step by step: a short lesson, a worked example, solving together, then a skill check to show it stuck.
Is MapleMind aligned to Ontario's official curriculum?
Yes. Every skill in this course maps to an official outcome code from Ontario's Grade 12 Mathematics curriculum, and the ministry's own wording is quoted under each unit on this page — with the official government source linked so you can check it yourself.
What does MapleMind cost?
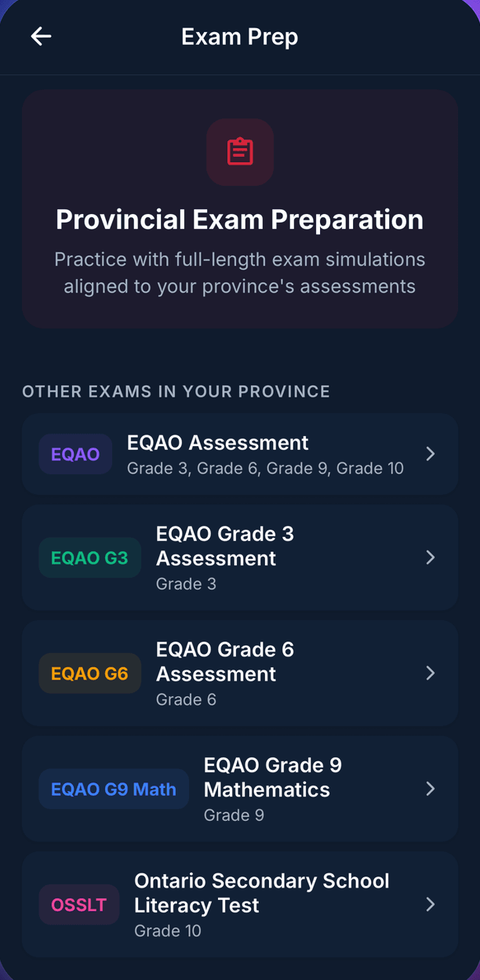
It's free to start — 5 tutoring chats and a practice quiz every day, no credit card. A Pro subscription ($9.99/month or $49.99/year CAD, 7-day free trial) unlocks unlimited tutoring, practice, and exam simulations.
What if I'm stuck on just one topic?
That's the point of skill-level tutoring: open Mathematics of Data Management, Grade 12 (University) in the app, tap the exact skill from the list on this page, and the tutor teaches just that — no wading through lessons you don't need.
Does MapleMind work in French or other languages?
Yes — 14 languages, including French. Both the app and the tutor's explanations switch to the language you choose.
Where can I see the official Ontario curriculum for Mathematics of Data Management, Grade 12 (University)?
The official source is linked on this page — Ontario's official mathematics curriculum. The outline here follows it: every MapleMind skill carries its official outcome code, and the ministry's own wording is quoted under each unit.
Keep exploring
Ready when you are
Pick a skill from this page and see it taught properly — free, in the browser, in under a minute.