Get help with Mathematics, Grade 4
Most tutoring makes your child sit through material your child already knows. MapleMind flips that: pick the exact skill that's causing trouble — any of the 48 below — and the tutor teaches just that one, step by step, as many times as it takes. Ask questions in plain words, any time of day, in English, French, or 12 other languages.
The official Ontario Mathematics, Grade 4 curriculum
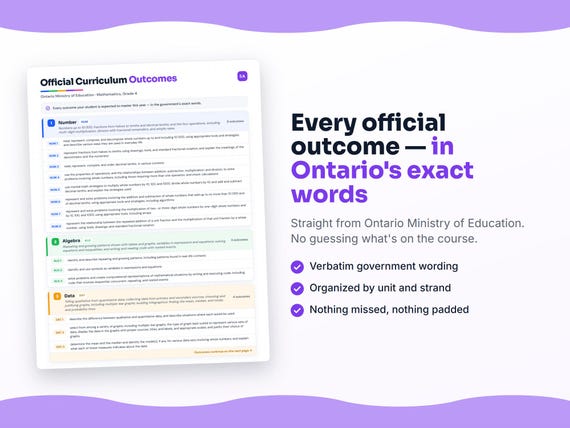
Ontario defines Mathematics, Grade 4 by strands and outcomes. MapleMind teaches the same curriculum reorganized for one-skill-at-a-time tutoring — the table shows exactly where every official strand lands, and the ministry's own wording is quoted under each unit below.
Official source Ontario's official mathematics curriculumRead it on the government site — dcp.edu.gov.on.ca ↗| Official strand | Outcomes | Where MapleMind teaches it |
|---|---|---|
| Strand B | 17 | Number |
| Strand C | 9 | Algebra |
| Strand D | 8 | Data |
| Strand E | 9 | Spatial Sense |
| Strand F | 5 | Financial Literacy |
Ontario also defines Strand A — Social-Emotional Learning Skills — which the ministry teaches through every other strand rather than as its own unit, so it doesn't get a row of its own.
Every skill below, taught one on one.
 Try the first session free
How MapleMind teaches Mathematics, Grade 4 — every unit, lesson, and skill
Every skill below runs as a short session: a plain-words lesson, a worked example, solving it together, then a five-question skill check that earns up to three stars. Guided Mode keeps it teaching instead of answer-handing — turning it off needs a parent's password.
Unit 1NumberOfficial strand · Strand B
Numbers up to 10 000; fractions from halves to tenths and decimal tenths; and the four operations, including multi-digit multiplication, division with fractional remainders, and simple rates.
Numbers to 10 000
- Reading, showing, building, and breaking apart numbers to 10 000B1.1 — Read whole numbers up to 10 000, show them different ways, build them from parts, and break them into parts, then talk about how numbers show up in everyday life.
- Comparing and ordering numbers to 10 000B1.2 — Compare two numbers up to 10 000 and put a group of numbers in order from least to greatest or greatest to least.
- Rounding to the nearest ten, hundred, or thousandB1.3 — Round whole numbers to the nearest ten, hundred, or thousand, depending on the situation.
Fractions from Halves to Tenths
- Writing and showing fractions from halves to tenthsB1.4 — Show fractions from halves to tenths using drawings, tools, and standard fraction notation, and explain what the numerator and denominator each mean.
- Counting to 10 by fractional amountsB1.6 — Count to 10 by halves, thirds, fourths, fifths, sixths, eighths, and tenths, with and without tools.
Decimal Tenths
- Reading, showing, comparing, and ordering decimal tenthsB1.7 — Read, show, compare, and order decimal tenths in different situations.
- Rounding decimal numbers to the nearest whole numberB1.8 — Round a decimal number to the nearest whole number in different situations.
- Showing how fractions and decimal tenths connectB1.9 — Describe relationships and show that fractions and decimal tenths can be equal to each other, in different situations.
How Operations Connect in Multi-Step Problems
- Using properties of operations to solve multi-step problemsB2.1 — Use the properties of the four operations, and how they relate to each other, to solve whole-number problems that need more than one operation, and to check answers.
- Multiplication and division facts to 10×10B2.2 — Know and quickly use multiplication facts from 1×1 to 10×10, and the matching division facts.
Mental Math: Multiplying/Dividing by 10s, and Decimal Tenths
- Mental math to multiply/divide by 10, 100, 1000, and add/subtract decimal tenthsB2.3 — Use mental math to multiply whole numbers by 10, 100, and 1000, divide whole numbers by 10, and add and subtract decimal tenths, explaining the strategies used.
Adding and Subtracting to 10 000 and with Decimal Tenths
- Solving addition and subtraction problems to 10 000 and with decimal tenthsB2.4 — Show and solve addition and subtraction problems with whole numbers up to 10 000 and with decimal tenths, using tools, strategies, and algorithms.
Multiplying and Dividing Multi-Digit Numbers
- Multiplying two- or three-digit numbers by a one-digit numberB2.5 — Show and solve problems involving the multiplication of two- or three-digit whole numbers by one-digit whole numbers and by 10, 100, and 1000, using tools including arrays.
- Dividing two- or three-digit numbers by a one-digit number, with fraction remaindersB2.6 — Show and solve division problems with two- or three-digit whole numbers divided by one-digit whole numbers, writing any remainder as a fraction when it makes sense to, using tools including arrays.
Unit Fractions and Rates
- Connecting repeated addition of a unit fraction to multiplying it by a whole numberB2.7 — Show how repeatedly adding a unit fraction connects to multiplying that unit fraction by a whole number, using tools, drawings, and standard fraction notation.
- Showing simple ratesB2.8 — Show simple relationships between two different kinds of quantities, like kilometres per hour, using tools and drawings.
The official wording — 17 outcomes in this unit
- B1.1
read, represent, compose, and decompose whole numbers up to and including 10 000, using appropriate tools and strategies, and describe various ways they are used in everyday life
- B1.2
compare and order whole numbers up to and including 10 000, in various contexts
- B1.3
round whole numbers to the nearest ten, hundred, or thousand, in various contexts
- B1.4
represent fractions from halves to tenths using drawings, tools, and standard fractional notation, and explain the meanings of the denominator and the numerator
- B1.5
use drawings and models to represent, compare, and order fractions representing the individual portions that result from two different fair-share scenarios involving any combination of 2, 3, 4, 5, 6, 8, and 10 sharers
- B1.6
count to 10 by halves, thirds, fourths, fifths, sixths, eighths, and tenths, with and without the use of tools
- B1.7
read, represent, compare, and order decimal tenths, in various contexts
- B1.8
round decimal numbers to the nearest whole number, in various contexts
- B1.9
describe relationships and show equivalences among fractions and decimal tenths, in various contexts
- B2.1
use the properties of operations, and the relationships between addition, subtraction, multiplication, and division, to solve problems involving whole numbers, including those requiring more than one operation, and check calculations
- B2.2
recall and demonstrate multiplication facts for 1 × 1 to 10 × 10, and related division facts
- B2.3
use mental math strategies to multiply whole numbers by 10, 100, and 1000, divide whole numbers by 10, and add and subtract decimal tenths, and explain the strategies used
- B2.4
represent and solve problems involving the addition and subtraction of whole numbers that add up to no more than 10 000 and of decimal tenths, using appropriate tools and strategies, including algorithms
- B2.5
represent and solve problems involving the multiplication of two- or three-digit whole numbers by one-digit whole numbers and by 10, 100, and 1000, using appropriate tools, including arrays
- B2.6
represent and solve problems involving the division of two- or three-digit whole numbers by one-digit whole numbers, expressing any remainder as a fraction when appropriate, using appropriate tools, including arrays
- B2.7
represent the relationship between the repeated addition of a unit fraction and the multiplication of that unit fraction by a whole number, using tools, drawings, and standard fractional notation
- B2.8
show simple multiplicative relationships involving whole-number rates, using various tools and drawings
Unit 2AlgebraOfficial strand · Strand C
Repeating and growing patterns shown with tables and graphs; variables in expressions and equations; solving equations and inequalities; and writing and reading code with nested events.
Repeating and Growing Patterns
- Spotting repeating and growing patternsC1.1 — Notice and describe patterns that repeat and patterns that grow, including patterns from everyday life.
- Making and re-showing patterns, including with graphsC1.2 — Create repeating and growing patterns, and show them using a table of values or a graph.
- Finding pattern rules for repeating and growing patternsC1.3 — Figure out the rule of a repeating or growing pattern, then use it to extend the pattern, make and check predictions, and fill in missing parts.
- Using patterns to show how whole numbers and decimal tenths relateC1.4 — Make and describe patterns that show relationships between whole numbers and decimal tenths.
Variables, Equations, and Inequalities
- Using symbols as variables in expressions and equationsC2.1 — Recognize and use symbols to stand for changing or unknown quantities in expressions and equations.
- Solving equations with whole numbers up to 50C2.2 — Solve equations that involve whole numbers up to 50 in different situations, and check that the solution works.
- Solving and graphing inequalities within 20C2.3 — Solve inequalities involving addition and subtraction of whole numbers up to 20, check the solutions, and show them on a number line.
Coding with Nested Loops
- Writing and running code with loops inside loopsC3.1 — Solve problems and show math situations by writing and running code, including code with loops inside other loops (nested events).
- Reading and changing code with nested loopsC3.2 — Read code with loops inside other loops, change it, and describe what happens differently.
The official wording — 9 outcomes in this unit
- C1.1
identify and describe repeating and growing patterns, including patterns found in real-life contexts
- C1.2
create and translate repeating and growing patterns using various representations, including tables of values and graphs
- C1.3
determine pattern rules and use them to extend patterns, make and justify predictions, and identify missing elements in repeating and growing patterns
- C1.4
create and describe patterns to illustrate relationships among whole numbers and decimal tenths
- C2.1
identify and use symbols as variables in expressions and equations
- C2.2
solve equations that involve whole numbers up to 50 in various contexts, and verify solutions
- C2.3
solve inequalities that involve addition and subtraction of whole numbers up to 20, and verify and graph the solutions
- C3.1
solve problems and create computational representations of mathematical situations by writing and executing code, including code that involves sequential, concurrent, repeating, and nested events
- C3.2
read and alter existing code, including code that involves sequential, concurrent, repeating, and nested events, and describe how changes to the code affect the outcomes
Unit 3DataOfficial strand · Strand D
Telling qualitative from quantitative data; collecting data from primary and secondary sources; choosing and justifying graphs, including multiple-bar graphs; building infographics; finding the mean, median, and mode; and probability lines.
Data Types and Collecting Data
- Telling qualitative and quantitative data apartD1.1 — Describe the difference between data that describes (qualitative) and data that counts or measures (quantitative), and when each would be used.
- Collecting data from different sources and using stem-and-leaf plotsD1.2 — Collect data from primary sources (like observations) and secondary sources (like already-published data) to compare two or more data sets, organizing the data in frequency tables and stem-and-leaf plots.
Choosing Graphs and Building Infographics
- Choosing and justifying the best graph, including multiple-bar graphsD1.3 — Choose the best graph, including a multiple-bar graph, to show a data set, display the data with a proper source, title, labels, and scale, and explain why that graph was chosen.
- Creating an infographic about a data setD1.4 — Build an infographic about a data set, showing the data in ways like frequency tables, stem-and-leaf plots, and multiple-bar graphs, plus other information that tells the story of the data.
Mean, Median, Mode, and Analysing Data
- Finding the mean, median, and mode of a data setD1.5 — Find the mean, the median, and the mode (or modes) of a data set involving whole numbers, and explain what each measure tells us.
- Asking and answering questions about data in stem-and-leaf and multiple-bar graphsD1.6 — Look closely at data shown in stem-and-leaf plots and multiple-bar graphs by asking and answering questions, then use it to make a good decision.
Probability Lines and Predictions
- Showing likelihood on a probability lineD2.1 — Use the words "impossible," "unlikely," "equally likely," "likely," and "certain" to describe how likely an event is, show it on a probability line, and use that to make predictions.
- Predicting if the mean, median, and mode will match in a different groupD2.2 — Make and test a prediction about whether the mean, median, and mode of a data set will be the same when collected from a different group.
The official wording — 8 outcomes in this unit
- D1.1
describe the difference between qualitative and quantitative data, and describe situations where each would be used
- D1.2
collect data from different primary and secondary sources to answer questions of interest that involve comparing two or more sets of data, and organize the data in frequency tables and stem-and-leaf plots
- D1.3
select from among a variety of graphs, including multiple-bar graphs, the type of graph best suited to represent various sets of data; display the data in the graphs with proper sources, titles, and labels, and appropriate scales; and justify their choice of graphs
- D1.4
create an infographic about a data set, representing the data in appropriate ways, including in frequency tables, stem-and-leaf plots, and multiple-bar graphs, and incorporating any other relevant information that helps to tell a story about the data
- D1.5
determine the mean and the median and identify the mode(s), if any, for various data sets involving whole numbers, and explain what each of these measures indicates about the data
- D1.6
analyse different sets of data presented in various ways, including in stem-and-leaf plots and multiple-bar graphs, by asking and answering questions about the data and drawing conclusions, then make convincing arguments and informed decisions
- D2.1
use mathematical language, including the terms "impossible", "unlikely", "equally likely", "likely", and "certain", to describe the likelihood of events happening, represent this likelihood on a probability line, and use it to make predictions and informed decisions
- D2.2
make and test predictions about the likelihood that the mean, median, and mode(s) of a data set will be the same for data collected from different populations
Unit 4Spatial SenseOfficial strand · Strand E
Geometric properties of rectangles; plotting coordinates in the first quadrant; translations and reflections; metric units of mass, capacity, and length; elapsed time; classifying angles; and the area of a rectangle.
Rectangles and the Coordinate Plane
- Naming the geometric properties of rectanglesE1.1 — Identify the geometric properties of rectangles, including the number of right angles, parallel and perpendicular sides, and lines of symmetry.
- Plotting and reading coordinates in the first quadrantE1.2 — Plot and read coordinates in the first quadrant of a Cartesian plane, and describe how a point translates from one coordinate to another.
Translations and Reflections
- Performing and predicting translations and reflections on a gridE1.3 — Describe and perform translations and reflections of a shape on a grid, and predict what the result will look like.
Metric Units for Mass, Capacity, and Length
- Grams and kilograms, litres and millilitres, with benchmarksE2.1 — Explain how grams and kilograms relate, and how litres and millilitres relate, and use benchmarks to estimate mass and capacity.
- Using metric prefixes and choosing the right unitE2.2 — Use metric prefixes to describe how big or small different metric units are, and choose the right units and tools for measuring length, mass, and capacity.
Elapsed Time and Classifying Angles
- Solving elapsed-time problemsE2.3 — Solve problems about how much time has passed by using the relationships between different units of time.
- Identifying and classifying anglesE2.4 — Identify angles and classify them as right, straight, acute, or obtuse.
Area of Rectangles
- Using arrays to measure the area of rectanglesE2.5 — Use the rows and columns of an array to measure the area of rectangles, and show that a rectangle's area can be found by multiplying its side lengths.
- Using the area-of-a-rectangle formula to find a missing measurementE2.6 — Use the formula for the area of a rectangle to find an unknown measurement (area, base, or height) when the other two are known.
The official wording — 9 outcomes in this unit
- E1.1
identify geometric properties of rectangles, including the number of right angles, parallel and perpendicular sides, and lines of symmetry
- E1.2
plot and read coordinates in the first quadrant of a Cartesian plane, and describe the translations that move a point from one coordinate to another
- E1.3
describe and perform translations and reflections on a grid, and predict the results of these transformations
- E2.1
explain the relationships between grams and kilograms as metric units of mass, and between litres and millilitres as metric units of capacity, and use benchmarks for these units to estimate mass and capacity
- E2.2
use metric prefixes to describe the relative size of different metric units, and choose appropriate units and tools to measure length, mass, and capacity
- E2.3
solve problems involving elapsed time by applying the relationships between different units of time
- E2.4
identify angles and classify them as right, straight, acute, or obtuse
- E2.5
use the row and column structure of an array to measure the areas of rectangles and to show that the area of any rectangle can be found by multiplying its side lengths
- E2.6
apply the formula for the area of a rectangle to find the unknown measurement when given two of the three
Unit 5Financial LiteracyOfficial strand · Strand F
Methods of payment; multi-item transaction costs and change; spending, saving, earning, investing, and donating; the relationship between spending and saving; and deciding if something is reasonably priced.
Methods of Payment and Transaction Costs
- Identifying different ways to pay for thingsF1.1 — Identify different methods of payment that can be used to buy goods and services.
- Estimating and calculating multi-item costs and changeF1.2 — Estimate and calculate the cost of buying several items priced in whole dollars (not including tax), and figure out the change owed when paying cash, using mental math.
Spending, Saving, and Making Money Decisions
- Understanding spending, saving, earning, investing, and donatingF1.3 — Explain what spending, saving, earning, investing, and donating mean, and describe key things to think about when making simple decisions about each.
- How spending and saving relate to each otherF1.4 — Explain how spending and saving relate to each other, and describe how spending and saving habits can differ from person to person.
- Deciding whether something is reasonably pricedF1.5 — Describe some ways to figure out if something is reasonably priced and therefore a good purchase.
The official wording — 5 outcomes in this unit
- F1.1
identify various methods of payment that can be used to purchase goods and services
- F1.2
estimate and calculate the cost of transactions involving multiple items priced in whole-dollar amounts, not including sales tax, and the amount of change needed when payment is made in cash, using mental math
- F1.3
explain the concepts of spending, saving, earning, investing, and donating, and identify key factors to consider when making basic decisions related to each
- F1.4
explain the relationship between spending and saving, and describe how spending and saving behaviours may differ from one person to another
- F1.5
describe some ways of determining whether something is reasonably priced and therefore a good purchase
Printable workbook · A keepsake of the year
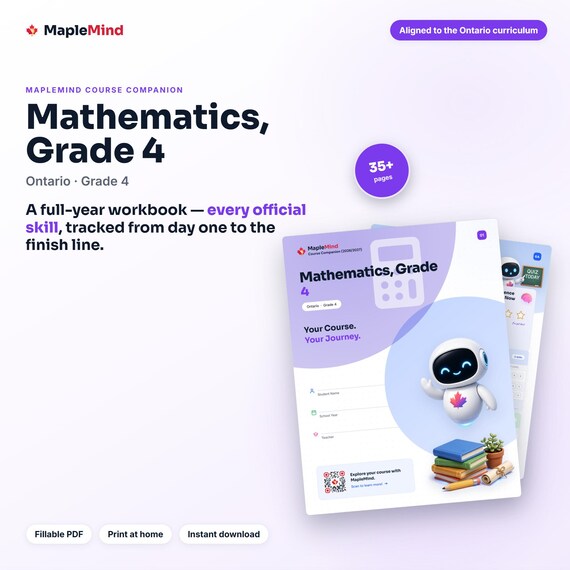
A Mathematics, Grade 4 workbook worth keeping
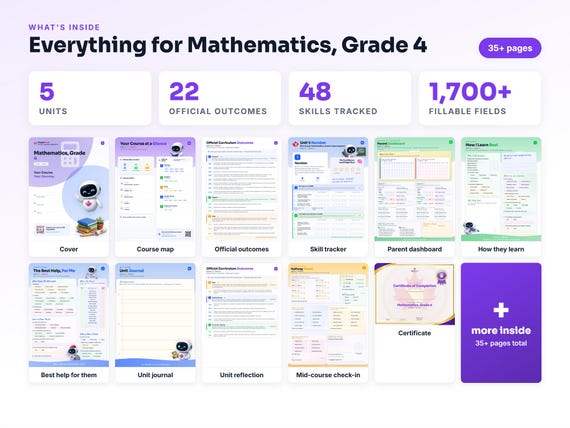
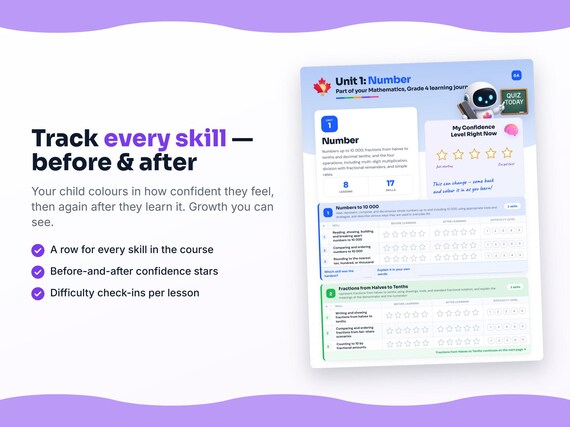
Built from the same official curriculum as this page. Before and after each skill above, your student colours in how sure they feel — so the two of you can see, on one page, what's clicking and what needs another look. It's a quiet way to follow how the year is really going.
By June it's full of their own handwriting: units worked through, confidence grown, a mid-year check-in, notes from parent-teacher night, and a certificate at the end. Less a worksheet, more a record of the year worth keeping on the shelf.
Instant download · see every page, reviews and the full description · five or more workbooks are $2.99 each
What it looks like in the app
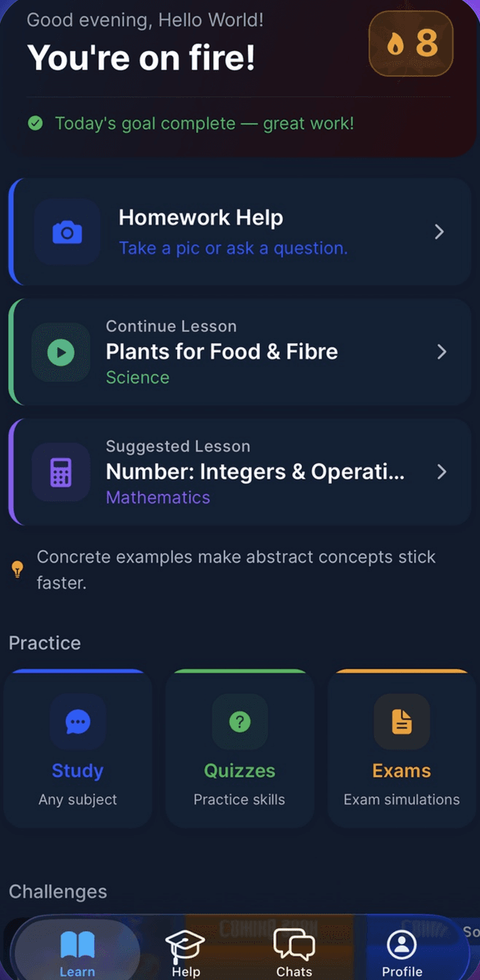
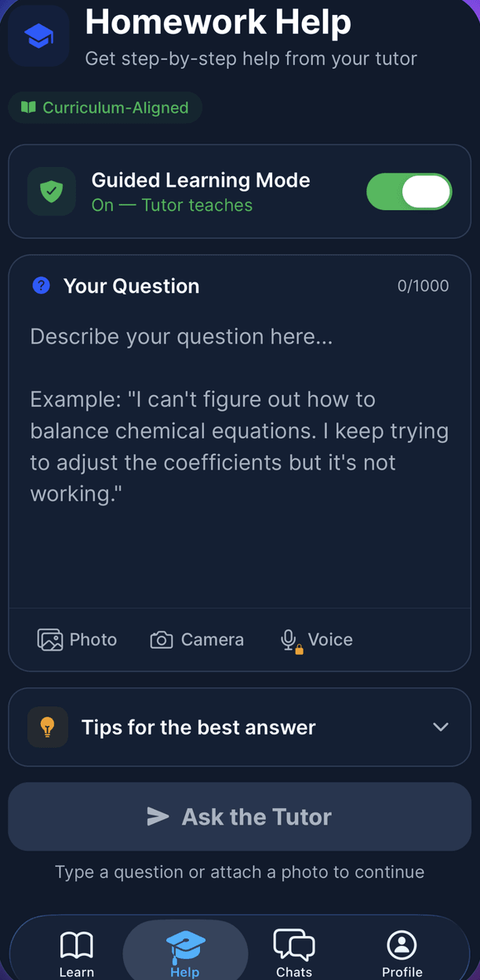
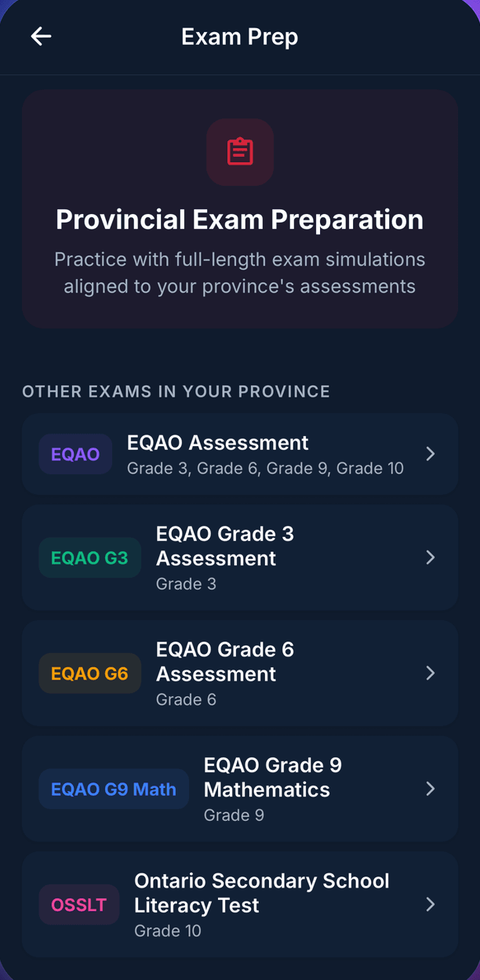
Common questions
Can MapleMind help my child with Mathematics, Grade 4?
Yes. MapleMind's AI tutor covers all 48 skills in Ontario's Mathematics, Grade 4 — your child picks the exact skill, and the tutor teaches it step by step: a short lesson, a worked example, solving together, then a skill check to show it stuck.
Is MapleMind aligned to Ontario's official curriculum?
Yes. Every skill in this course maps to an official outcome code from Ontario's Grade 4 Mathematics curriculum, and the ministry's own wording is quoted under each unit on this page — with the official government source linked so you can check it yourself.
What does MapleMind cost?
It's free to start — 5 tutoring chats and a practice quiz every day, no credit card. A Pro subscription ($9.99/month or $49.99/year CAD, 7-day free trial) unlocks unlimited tutoring, practice, and exam simulations.
What if my child is stuck on just one topic?
That's the point of skill-level tutoring: open Mathematics, Grade 4 in the app, tap the exact skill from the list on this page, and the tutor teaches just that — no wading through lessons your child doesn't need.
Does MapleMind work in French or other languages?
Yes — 14 languages, including French. Both the app and the tutor's explanations switch to the language your child chooses.
Where can I see the official Ontario curriculum for Mathematics, Grade 4?
The official source is linked on this page — Ontario's official mathematics curriculum. The outline here follows it: every MapleMind skill carries its official outcome code, and the ministry's own wording is quoted under each unit.
Keep exploring
Ready when you are
Pick a skill from this page and see it taught properly — free, in the browser, in under a minute.