Get help with Foundations for College Mathematics, Grade 12 (College)
Most tutoring makes you sit through material you already know. MapleMind flips that: pick the exact skill that's causing trouble — any of the 59 below — and the tutor teaches just that one, step by step, as many times as it takes. Ask questions in plain words, any time of day, in English, French, or 12 other languages.
The official Ontario Foundations for College Mathematics, Grade 12 (College) curriculum
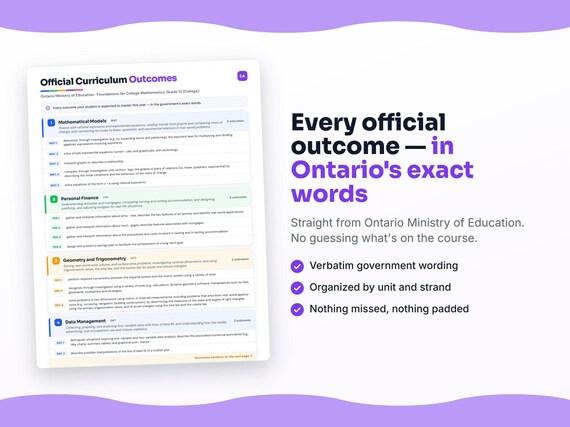
Ontario defines Foundations for College Mathematics, Grade 12 (College) by strands and outcomes. MapleMind teaches the same curriculum reorganized for one-skill-at-a-time tutoring — the table shows exactly where every official strand lands, and the ministry's own wording is quoted under each unit below.
Official source Ontario's official mathematics curriculumRead it on the government site — dcp.edu.gov.on.ca ↗| Official strand | Outcomes | Where MapleMind teaches it |
|---|---|---|
| Strand A | 18 | Mathematical Models |
| Strand B | 17 | Personal Finance |
| Strand C | 11 | Geometry and Trigonometry |
| Strand D | 13 | Data Management |
Every skill below, taught one on one.
 Try the first session free
How MapleMind teaches Foundations for College Mathematics, Grade 12 (College) — every unit, lesson, and skill
Every skill below runs as a short session: a plain-words lesson, a worked example, solving it together, then a five-question skill check that earns up to three stars. Guided Mode keeps it teaching instead of answer-handing — turning it off needs a parent's password.
Unit 1Mathematical ModelsOfficial strand · Strand A
Powers with rational exponents and exponential equations; reading trends from graphs and comparing rates of change; and connecting formulas to linear, quadratic, and exponential relations in real-world problems.
Exponent Laws and Rational Exponents
- Exponent laws for multiplying, dividing, and powers of powersmap4c.1.1 — Investigate, by expanding terms and patterning, the exponent laws for multiplying and dividing algebraic expressions with exponents, and the law for a power of a power.
- Simplifying expressions with integer exponentsmap4c.1.2 — Simplify algebraic expressions containing integer exponents using the laws of exponents.
- Investigating the value of a power with a rational exponentmap4c.1.3 — Investigate, using tools like a calculator, patterning, or reading values from a graph, the value of a power with a rational exponent.
- Evaluating numerical expressions with rational exponents and basesmap4c.1.4 — Evaluate, with or without technology, numerical expressions involving rational exponents and rational bases.
Solving Exponential Equations
- Solving simple exponential equations numerically and graphicallymap4c.1.5 — Solve simple exponential equations numerically and graphically with technology, recognizing that solutions may not be exact.
- Solving real-world exponential problems with a graph or table of valuesmap4c.1.6 — Solve problems involving exponential equations from real-world applications by using a graph or table of values generated with technology from a given equation.
- Solving exponential equations using a common basemap4c.1.7 — Solve exponential equations in one variable by determining a common base, and verify by substitution.
Interpreting Graphs and Describing Trends
- Interpreting graphs to describe a relationshipmap4c.1.8 — Interpret graphs to describe a relationship between two quantities, using language and units appropriate to the context.
- Describing trends from graphs to make predictionsmap4c.1.9 — Describe trends based on given graphs, and use the trends to make predictions or justify decisions.
- Identifying the units of a rate of change from a graph or tablemap4c.1.10 — Recognize that graphs and tables of values communicate rate of change, and identify the units used to measure rate of change from a given graph or table.
- Identifying and comparing rate of change: zero, constant, or changingmap4c.1.11 — Identify when the rate of change is zero, constant, or changing given a table of values or graph, and compare two graphs by describing rate of change.
Modelling Graphically
- Comparing linear, quadratic, and exponential graphs by initial conditions and rate of changemap4c.1.12 — Compare, through investigation with technology, the graphs of pairs of linear, quadratic, and exponential relations by describing initial conditions and rate-of-change behaviour.
- Selecting a linear, quadratic, or exponential model for datamap4c.1.13 — Recognize that a linear model shows constant increase/decrease and an exponential model shows constant percentage change; select and use a model to represent numerical data graphically and algebraically, and solve related problems.
Modelling Algebraically
- Solving equations of the form xⁿ = a using rational exponentsmap4c.1.14 — Solve equations of the form xⁿ = a using rational exponents, by raising both sides to an exponent.
- Determining a variable's value from a real-world formulamap4c.1.15 — Determine the value of a variable of degree no higher than three, using a formula from an application, by substituting known values then solving, and by isolating the variable then substituting.
- Connecting formulas to linear, quadratic, and exponential functionsmap4c.1.16 — Make connections between formulas and linear, quadratic, and exponential functions, using tools and strategies like comparing graphs when different variables in a formula are set as constants.
- Solving multi-step real-world problems using formulasmap4c.1.17 — Solve multi-step problems requiring formulas arising from real-world applications.
- Gathering information about mathematical modelling in occupations and college programsmap4c.1.18 — Gather, interpret, and describe information about applications of mathematical modelling in occupations, and about college programs that explore these applications.
The official wording — 18 outcomes in this unit
- map4c.1.1
determine, through investigation (e.g., by expanding terms and patterning), the exponent laws for multiplying and dividing algebraic expressions involving exponents
- map4c.1.2
simplify algebraic expressions containing inte- ger exponents using the laws of exponents
- map4c.1.3
determine, through investigation using a variety of tools (e.g., calculator, paper and pencil, graphing technology) and strategies (e.g., patterning
- map4c.1.4
evaluate, with or without technology, numeri- cal expressions involving rational exponents and rational bases
- map4c.1.5
solve simple exponential equations numeri- cally and graphically, with technology
- map4c.1.6
solve problems involving exponential equa- tions arising from real-world applications by using a graph or table of values generated with technology from a given equation
- map4c.1.7
solve exponential equations in one variable by determining a common base
- map4c.1.8
interpret graphs to describe a relationship
- map4c.1.9
describe trends based on given graphs, and use the trends to make predictions or justify decisions
- map4c.1.10
recognize that graphs and tables of values communicate information about rate of change, and use a given graph or table of values for a relation to identify the units used to measure rate of change
- map4c.1.11
identify when the rate of change is zero, constant, or changing, given a table of values or a graph of a relation, and compare two graphs by describing rate of change
- map4c.1.12
compare, through investigation with techno- logy, the graphs of pairs of relations (i.e., linear, quadratic, exponential) by describing the initial conditions and the behaviour of the rates of change
- map4c.1.13
recognize that a linear model corresponds to a constant increase or decrease over equal intervals and that an exponential model corresponds to a constant percentage increase or decrease over equal intervals, select a model (i.e., linear, quadratic, exponential) to represent the relationship between numerical data graphically and algebraically
- map4c.1.14
solve equations of the form x = a using rational exponents
- map4c.1.15
determine the value of a variable of degree no higher than three, using a formula drawn from an application
- map4c.1.16
make connections between formulas and lin- ear, quadratic, and exponential functions
- map4c.1.17
solve multi-step problems requiring formulas arising from real-world applications
- map4c.1.18
gather, interpret, and describe information about applications of mathematical modelling in occupations, and about college programs
Unit 2Personal FinanceOfficial strand · Strand B
Understanding annuities and mortgages; comparing owning and renting accommodation; and designing, justifying, and adjusting budgets for real-life situations.
Understanding Annuities
- Key features and real-world applications of annuitiesmap4c.2.1 — Gather and interpret information about annuities, describe their key features, and identify real-world applications like RRSPs, mortgages, RRIFs, and RESPs.
- Investigating the effects of changing annuity conditionsmap4c.2.2 — Investigate, with technology like the TVM Solver, the effects of changing the payments, frequency, interest rate, or compounding period of an ordinary simple annuity.
- Solving for the amount, present value, and regular payment of an annuitymap4c.2.3 — Solve problems, using technology like a scientific calculator or spreadsheet, that involve the amount, present value, and regular payment of an ordinary simple annuity.
- The advantages of starting annuity deposits earliermap4c.2.4 — Demonstrate, with technology like a TVM Solver, the advantages of starting deposits earlier when investing in annuities used as long-term savings plans.
Understanding and Working With Mortgages
- Mortgage features and comparing mortgage typesmap4c.2.5 — Gather and interpret information about mortgages, describe their features, and compare different types of mortgages like open, closed, and variable-rate.
- Reading and interpreting an amortization tablemap4c.2.6 — Read and interpret an amortization table for a mortgage.
- Generating an amortization table and calculating total mortgage interestmap4c.2.7 — Generate an amortization table for a mortgage using tools and strategies like an online mortgage calculator or spreadsheet, calculate total interest paid, and compare it to the principal.
- Investigating the effects of varying payment periods, payments, and rates on a mortgagemap4c.2.8 — Investigate, with technology, the effects of varying payment periods, regular payments, and interest rates on the time to pay off a mortgage and on total interest paid.
Renting or Owning Accommodation
- Gathering information about the costs of owning and rentingmap4c.2.9 — Gather and interpret information about the procedures and costs involved in owning and in renting accommodation in the local community.
- Comparing the advantages and disadvantages of renting versus owningmap4c.2.10 — Compare renting accommodation with owning accommodation by describing the advantages and disadvantages of each.
- Solving problems with fixed and variable costs of accommodationmap4c.2.11 — Solve problems, using technology, that involve the fixed costs like mortgage, insurance, and property tax, and variable costs like maintenance and utilities, of owning or renting accommodation.
- Estimating the living costs of different householdsmap4c.2.12 — Gather, interpret, and describe information about living costs, and estimate the living costs of different households in the local community.
Designing Budgets
- Designing and presenting a savings plan for a long-term goalmap4c.2.13 — Design and present a savings plan to facilitate the achievement of a long-term goal, like attending college or buying a car or house.
- Designing, explaining, and justifying a monthly budget from a case studymap4c.2.14 — Design, explain, and justify a monthly budget suitable for an individual or family described in a case study, using technology and without technology.
- Identifying factors in the affordability of accommodationmap4c.2.15 — Identify and describe the factors to be considered in determining the affordability of accommodation in the local community, and consider affordability under given circumstances.
- Adjusting a budget for changed circumstancesmap4c.2.16 — Make adjustments to a budget to accommodate changes in circumstances, like a job change or a major purchase, with technology.
- Gathering information about personal finance applications in occupationsmap4c.2.17 — Gather, interpret, and describe information about applications of the mathematics of personal finance in occupations, and about college programs that explore these applications.
The official wording — 17 outcomes in this unit
- map4c.2.1
gather and interpret information about annu- ities, describe the key features of an annuity, and identify real-world applications
- map4c.2.2
determine, through investigation using tech- nology (e.g., the TVM Solver on a graphing calculator; online tools), the effects of chang- ing the conditions
- map4c.2.3
solve problems, using technology (e.g., scien- tific calculator, spreadsheet, graphing calcula- tor), that involve the amount, the present value, and the regular payment of an ordinary simple annuity
- map4c.2.4
demonstrate, through investigation using technology (e.g., a TVM Solver), the advan- tages of starting deposits earlier when invest- ing in annuities used as long-term savings plans
- map4c.2.5
gather and interpret information about mort- gages, describe features associated with mortgages
- map4c.2.6
read and interpret an amortization table for a mortgage
- map4c.2.7
generate an amortization table for a mortgage, using a variety of tools and strategies
- map4c.2.8
determine, through investigation using tech- nology (e.g., TVM Solver, online tools, finan- cial software), the effects of varying payment periods, regular payments, and interest rates on the length of time needed to pay off a mortgage and on the total interest paid
- map4c.2.9
gather and interpret information about the procedures and costs involved in owning and in renting accommodation
- map4c.2.10
compare renting accommodation with owning accommodation by describing the advantages and disadvantages of each
- map4c.2.11
solve problems, using technology (e.g., calcu- lator, spreadsheet), that involve the fixed costs
- map4c.2.12
gather, interpret, and describe information about living costs, and estimate the living costs of different households
- map4c.2.13
design and present a savings plan to facilitate the achievement of a long-term goal
- map4c.2.14
design, explain, and justify a monthly budget suitable for an individual or family described in a given case study
- map4c.2.15
identify and describe the factors to be consi- dered in determining the affordability of accommodation in the local community
- map4c.2.16
make adjustments to a budget to accommo- date changes in circumstances
- map4c.2.17
gather, interpret, and describe information about applications of the mathematics of per- sonal finance in occupations
Unit 3Geometry and TrigonometryOfficial strand · Strand C
Solving real-world area, volume, and surface area problems; investigating optimal dimensions; and using trigonometric ratios, the sine law, and the cosine law for acute and obtuse triangles.
Solving Problems Involving Measurement and Geometry
- Converting between the imperial and metric systemsmap4c.3.1 — Perform required conversions between the imperial system and the metric system using tools like tables, calculators, and online conversion tools, as needed within applications.
- Solving real-world problems with areas of rectangles, triangles, circles, and composite shapesmap4c.3.2 — Solve problems involving the areas of rectangles, triangles, and circles, and related composite shapes, in real-world applications.
- Solving real-world problems with volumes and surface areas of prisms, cylinders, and composite figuresmap4c.3.3 — Solve problems involving the volumes and surface areas of rectangular prisms, triangular prisms, and cylinders, and related composite figures, in real-world applications.
Investigating Optimal Dimensions
- Recognizing and explaining the significance of optimal perimeter, area, surface area, and volumemap4c.3.4 — Recognize, through investigation with tools like calculators, dynamic geometry software, and manipulatives, and explain the significance of optimal perimeter, area, surface area, and volume in various applications.
- Determining the optimal dimensions of a 2D shape for a given constraintmap4c.3.5 — Determine, through investigation using tools like calculators, dynamic geometry software, and manipulatives, the optimal dimensions of a two-dimensional shape in metric or imperial units for a given constraint.
- Determining the optimal dimensions of a prism or cylinder for a given constraintmap4c.3.6 — Determine, through investigation with tools and strategies like modelling, tables of values, and graphing, the optimal dimensions of a right rectangular prism, right triangular prism, and right cylinder in metric or imperial units for a given constraint.
Solving Problems Involving Trigonometry
- Solving real-world 2D problems with right and acute trianglesmap4c.3.7 — Solve problems in two dimensions using metric or imperial measurements, including real-world applications like surveying and navigation, by determining sides and angles of right triangles with primary trig ratios and acute triangles with the sine law and cosine law.
- Connecting trigonometric ratios of obtuse angles to acute anglesmap4c.3.8 — Make connections between the primary trigonometric ratios of obtuse angles and of acute angles, through investigation with tools like dynamic geometry software and a scientific calculator.
- Determining the sine, cosine, and tangent of obtuse anglesmap4c.3.9 — Determine the values of the sine, cosine, and tangent of obtuse angles.
- Solving real-world problems with oblique triangles using the sine and cosine lawsmap4c.3.10 — Solve problems involving oblique triangles, including real-world applications, using the sine law in non-ambiguous cases and the cosine law, in metric or imperial units.
- Gathering information about trigonometry applications in occupationsmap4c.3.11 — Gather, interpret, and describe information about applications of trigonometry in occupations, and about college programs that explore these applications.
The official wording — 11 outcomes in this unit
- map4c.3.1
perform required conversions between the imperial system and the metric system using a variety of tools
- map4c.3.2
solve problems involving the areas of rectan- gles, triangles, and circles, and of related composite shapes, in situations arising from real-world applications
- map4c.3.3
solve problems involving the volumes and surface areas of rectangular prisms, triangular prisms, and cylinders, and of related compo- site figures, in situations arising from real- world applications
- map4c.3.4
recognize, through investigation using a variety of tools (e.g., calculators; dynamic geometry software; manipulatives such as tiles, geoboards, toothpicks) and strategies
- map4c.3.5
determine, through investigation using a variety of tools (e.g., calculators, dynamic geometry software, manipulatives) and strat- egies (e.g., modelling; making a table of values; graphing), the optimal dimensions of a two- dimensional shape
- map4c.3.6
determine, through investigation using a vari- ety of tools and strategies (e.g., modelling with manipulatives; making a table of values; graphing), the optimal dimensions of a right rectangular prism, a right triangular prism, and a right cylinder
- map4c.3.7
solve problems in two dimensions using metric or imperial measurements, including problems that arise from real-world applica- tions (e.g., surveying, navigation, building construction), by determining the measures of the sides and angles of right triangles using the primary trigonometric ratios, and of acute triangles using the sine law and the cosine law
- map4c.3.8
make connections between primary trigono- metric ratios (i.e., sine, cosine, tangent) of obtuse angles and of acute angles, through investigation using a variety of tools and strategies
- map4c.3.9
determine the values of the sine, cosine, and tangent of obtuse angles
- map4c.3.10
solve problems involving oblique triangles, including those that arise from real-world applications, using the sine law (in non- ambiguous cases only) and the cosine law, and using metric or imperial units
- map4c.3.11
gather, interpret, and describe information about applications of trigonometry in occupa- tions, and about college programs that explore these applications
Unit 4Data ManagementOfficial strand · Strand D
Collecting, graphing, and analysing two-variable data with lines of best fit; and understanding how the media, advertising, and occupations use and misuse statistics.
Working With Two-Variable Data
- Distinguishing situations needing one-variable versus two-variable analysismap4c.4.1 — Distinguish situations requiring one-variable and two-variable data analysis, describe the associated numerical and graphical summaries, and recognize the questions each type of analysis addresses.
- Designing questionnaires and experiments for two-variable datamap4c.4.2 — Describe characteristics of an effective survey, considering ethics, privacy, honesty, and possible bias, and design questionnaires or experiments for gathering two-variable data.
- Collecting and organizing two-variable data from primary and secondary sourcesmap4c.4.3 — Collect two-variable data from primary or secondary sources, and organize and store the data using tools like spreadsheets and dynamic statistical software.
- Creating a scatter plot for two-variable datamap4c.4.4 — Create a graphical summary of two-variable data using a scatter plot, identifying dependent and independent variables and drawing a line of best fit when appropriate.
- Determining the equation of a line of best fitmap4c.4.5 — Determine an algebraic summary of the relationship between two linearly related variables (the equation of the line of best fit), using tools and strategies, and solve related problems.
Interpreting and Drawing Conclusions From Two-Variable Data
- Interpreting a line of best fit and reasons for misinterpretationmap4c.4.6 — Describe possible interpretations of a scatter plot's line of best fit and reasons for misinterpretations, like a small sample or an outlier's effect.
- Assessing whether a linear model is appropriate by examining correlationmap4c.4.7 — Determine whether a linear model is appropriate for a set of two-variable data by assessing the correlation between the two variables.
- Drawing and judging conclusions from two-variable data analysismap4c.4.8 — Make conclusions from the analysis of two-variable data, and judge the reasonableness of the conclusions.
Applying Data Management
- Recognizing and interpreting common statistical terms used in the mediamap4c.4.9 — Recognize and interpret common statistical terms and expressions used in the media, like percentile, quartile, and "accurate 19 times out of 20."
- Describing and solving problems using media indicesmap4c.4.10 — Describe examples of indices used by the media, and solve problems by interpreting and using indices like the consumer price index.
- Interpreting media statistics and explaining how statistics are used and misusedmap4c.4.11 — Interpret statistics presented in the media, and explain how the media, advertising industry, and others use and misuse statistics to promote a point of view.
- Assessing the validity of conclusions presented in the mediamap4c.4.12 — Assess the validity of conclusions presented in the media by examining data sources, methods of data collection, possible bias, and the analysis and conclusions drawn.
- Gathering information about data management applications in occupationsmap4c.4.13 — Gather, interpret, and describe information about applications of data management in occupations, and about college programs that explore these applications.
The official wording — 13 outcomes in this unit
- map4c.4.1
distinguish situations requiring one-variable and two-variable data analysis, describe the associated numerical summaries (e.g., tally charts, summary tables) and graphical sum- maries
- map4c.4.2
describe characteristics of an effective survey (e.g., by giving consideration to ethics, priva- cy, the need for honest responses, and possi- ble sources of bias, including cultural bias), and design questionnaires
- map4c.4.3
collect two-variable data from primary sources, through experimentation involving observa- tion or measurement, or from secondary sources
- map4c.4.4
create a graphical summary of two-variable data using a scatter plot
- map4c.4.5
determine an algebraic summary of the rela- tionship between two variables that appear to be linearly related (i.e., the equation of the line of best fit of the scatter plot)
- map4c.4.6
describe possible interpretations of the line of best fit of a scatter plot
- map4c.4.7
determine whether a linear model (i.e., a line of best fit) is appropriate given a set of two- variable data, by assessing the correlation
- map4c.4.8
make conclusions from the analysis of two- variable data
- map4c.4.9
recognize and interpret common statistical terms (e.g., percentile, quartile) and expres- sions
- map4c.4.10
describe examples of indices used by the media (e.g., consumer price index, S&P/TSX composite index, new housing price index) and solve problems by interpreting and using indices
- map4c.4.11
interpret statistics presented in the media
- map4c.4.12
assess the validity of conclusions presented in the media by examining sources of data
- map4c.4.13
gather, interpret, and describe information about applications of data management in occupations, and about college programs that explore these applications
Printable workbook · A keepsake of the year
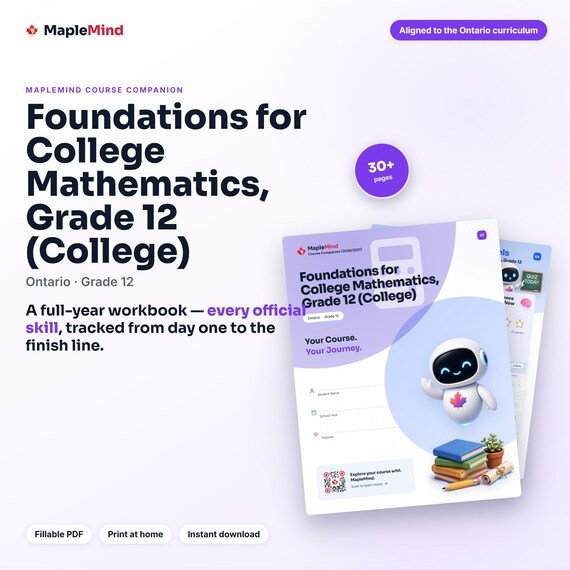
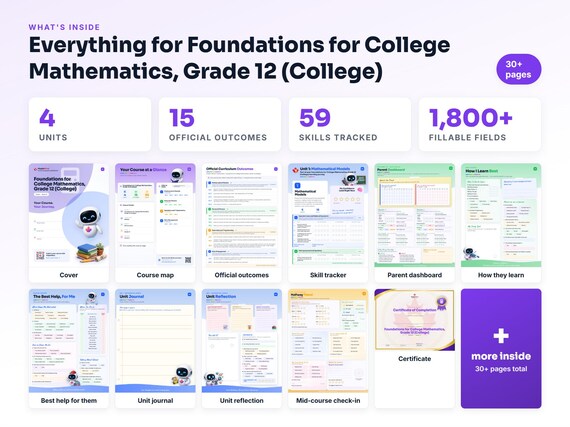
A Foundations for College Mathematics, Grade 12 (College) workbook worth keeping
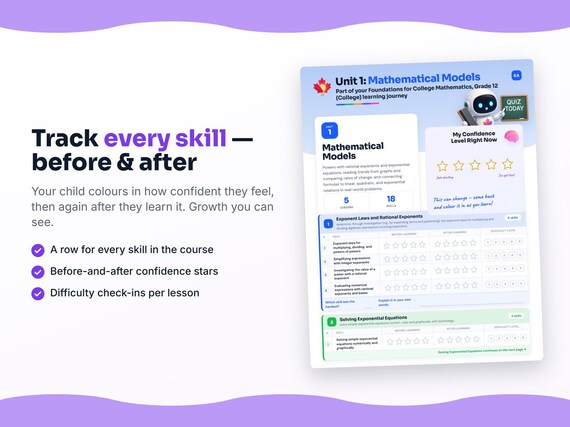
Built from the same official curriculum as this page. Before and after each skill above, your student colours in how sure they feel — so the two of you can see, on one page, what's clicking and what needs another look. It's a quiet way to follow how the year is really going.
By June it's full of their own handwriting: units worked through, confidence grown, a mid-year check-in, notes from parent-teacher night, and a certificate at the end. Less a worksheet, more a record of the year worth keeping on the shelf.
Instant download · see every page, reviews and the full description · five or more workbooks are $2.99 each
What it looks like in the app


Common questions
Can MapleMind help me with Foundations for College Mathematics, Grade 12 (College)?
Yes. MapleMind's AI tutor covers all 59 skills in Ontario's Foundations for College Mathematics, Grade 12 (College) — you pick the exact skill, and the tutor teaches it step by step: a short lesson, a worked example, solving together, then a skill check to show it stuck.
Is MapleMind aligned to Ontario's official curriculum?
Yes. Every skill in this course maps to an official outcome code from Ontario's Grade 12 Mathematics curriculum, and the ministry's own wording is quoted under each unit on this page — with the official government source linked so you can check it yourself.
What does MapleMind cost?
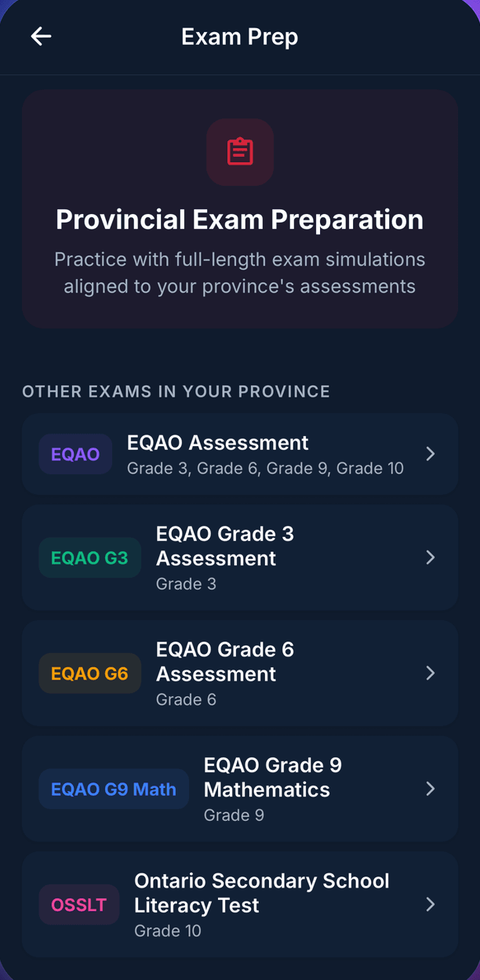
It's free to start — 5 tutoring chats and a practice quiz every day, no credit card. A Pro subscription ($9.99/month or $49.99/year CAD, 7-day free trial) unlocks unlimited tutoring, practice, and exam simulations.
What if I'm stuck on just one topic?
That's the point of skill-level tutoring: open Foundations for College Mathematics, Grade 12 (College) in the app, tap the exact skill from the list on this page, and the tutor teaches just that — no wading through lessons you don't need.
Does MapleMind work in French or other languages?
Yes — 14 languages, including French. Both the app and the tutor's explanations switch to the language you choose.
Where can I see the official Ontario curriculum for Foundations for College Mathematics, Grade 12 (College)?
The official source is linked on this page — Ontario's official mathematics curriculum. The outline here follows it: every MapleMind skill carries its official outcome code, and the ministry's own wording is quoted under each unit.
Keep exploring
Ready when you are
Pick a skill from this page and see it taught properly — free, in the browser, in under a minute.