Get help with Mathematics, Grade 9
Most tutoring makes you sit through material you already know. MapleMind flips that: pick the exact skill that's causing trouble — any of the 38 below — and the tutor teaches just that one, step by step, as many times as it takes. Ask questions in plain words, any time of day, in English, French, or 12 other languages.
The official New Brunswick Mathematics, Grade 9 curriculum
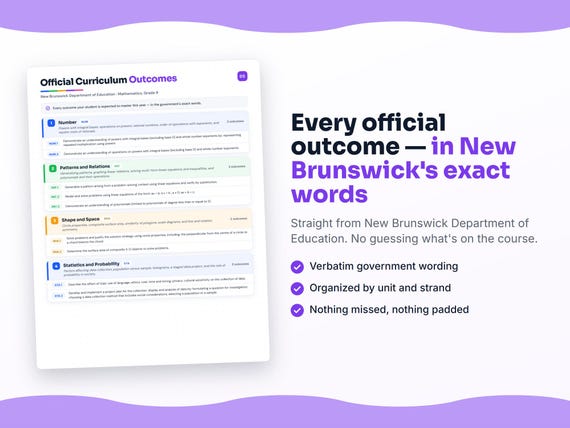
New Brunswick defines Mathematics, Grade 9 by strands and outcomes. MapleMind teaches the same curriculum reorganized for one-skill-at-a-time tutoring — the table shows exactly where every official strand lands, and the ministry's own wording is quoted under each unit below.
Official source New Brunswick's official K-12 education resourcesRead it on the government site — www2.gnb.ca ↗| Official strand | Outcomes | Where MapleMind teaches it |
|---|---|---|
| Strand N | 6 | Number |
| Strand PR | 7 | Patterns and Relations |
| Strand SS | 5 | Shape and Space |
| Strand SP | 5 | Statistics and Probability |
Every skill below, taught one on one.
 Try the first session free
How MapleMind teaches Mathematics, Grade 9 — every unit, lesson, and skill
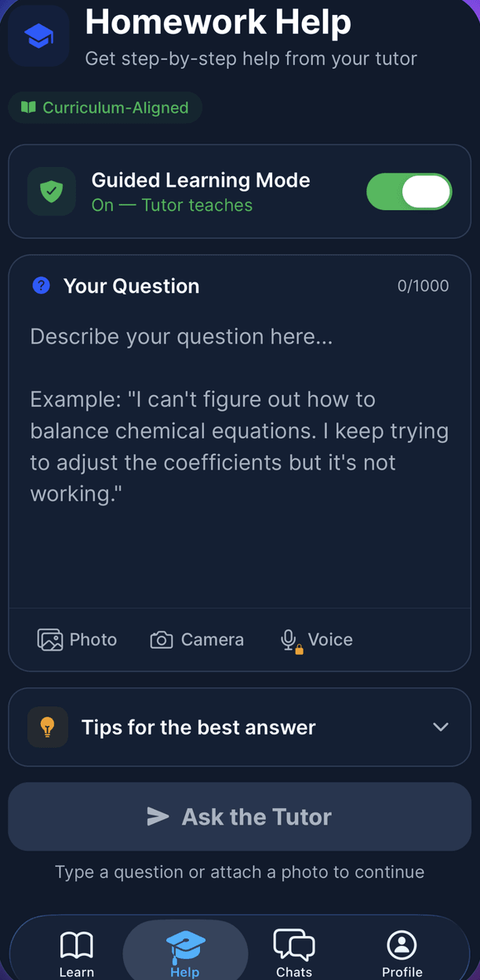
Every skill below runs as a short session: a plain-words lesson, a worked example, solving it together, then a five-question skill check that earns up to three stars. Guided Mode keeps it teaching instead of answer-handing — turning it off needs a parent's password.
Unit 1NumberOfficial strand · Strand N
Powers with integral bases, operations on powers, rational numbers, order of operations with exponents, and square roots of rationals.
Powers
- Powers as repeated multiplicationN1 — Represent repeated multiplication using powers with integral bases (excluding base 0) and whole number exponents.
- The zero exponentN1 — Use patterns to show that a power with an exponent of zero is equal to one.
- Solving problems with powersN1 — Solve problems involving powers with integral bases and whole number exponents.
Operations on Powers and Rational Numbers
- Multiplying and dividing powersN2 — Demonstrate an understanding of multiplying and dividing powers with the same base, with integral bases and whole number exponents.
- Power of a powerN2 — Demonstrate an understanding of raising a power to a power, with integral bases and whole number exponents.
- Comparing and ordering rational numbersN3 — Compare and order rational numbers, including positive and negative fractions and decimals.
- Operations on rational numbersN3 — Solve problems that involve arithmetic operations on rational numbers.
- Order of operations with exponentsN4 — Explain and apply the order of operations, including exponents, with and without technology.
- Square root of perfect squaresN5 — Determine the square root of positive rational numbers that are perfect squares.
- Approximate square root of non-perfect squaresN6 — Determine an approximate square root of positive rational numbers that are non-perfect squares.
The official wording — 6 outcomes in this unit
- N1
Demonstrate an understanding of powers with integral bases (excluding base 0) and whole number exponents by: representing repeated multiplication using powers
- N2
Demonstrate an understanding of operations on powers with integral bases (excluding base 0) and whole number exponents.
- N3
Demonstrate an understanding of rational numbers by: comparing and ordering rational numbers
- N4
Explain and apply the order of operations, including exponents, with and without technology.
- N5
Determine the square root of positive rational numbers that are perfect squares.
- N6
Determine an approximate square root of positive rational numbers that are non-perfect squares.
Unit 2Patterns and RelationsOfficial strand · Strand PR
Generalizing patterns, graphing linear relations, solving multi-form linear equations and inequalities, and polynomials and their operations.
Patterns and Linear Relations
- Generalizing a pattern with a linear equationPR1 — Generalize a pattern arising from a problem-solving context using a linear equation and verify by substitution.
- Graphing and interpolating linear relationsPR2 — Graph linear relations, analyze the graph, and interpolate or extrapolate to solve problems.
Linear Equations and Inequalities
- One-step linear equationsPR3 — Model and solve problems using one-step linear equations of the forms ax = b, a/x = b, and x/a = b, where the coefficients are rational numbers.
- Two-step linear equationsPR3 — Model and solve problems using two-step linear equations of the forms ax + b = c and a/x + b = c, where the coefficients are rational numbers.
- Equations with variables on both sidesPR3 — Model and solve problems using linear equations with variables on both sides, of the forms ax + b = cx + d and ax = b + cx, where the coefficients are rational numbers.
- Bracketed and distributive equationsPR3 — Model and solve problems using linear equations with brackets, of the forms a(bx + c) = d(ex + f) and a(x + b) = c, where the coefficients are rational numbers.
- Single-variable linear inequalitiesPR4 — Explain and illustrate strategies to solve single-variable linear inequalities with rational coefficients within a problem-solving context.
Polynomials
- Understanding polynomialsPR5 — Demonstrate an understanding of polynomials, limited to polynomials of degree less than or equal to 2.
- Adding polynomialsPR6 — Model, record, and explain the addition of polynomial expressions, concretely, pictorially, and symbolically, limited to degree 2.
- Subtracting polynomialsPR6 — Model, record, and explain the subtraction of polynomial expressions, concretely, pictorially, and symbolically, limited to degree 2.
- Multiplying polynomials by monomialsPR7 — Model, record, and explain the multiplication of polynomial expressions by monomials, concretely, pictorially, and symbolically, limited to degree 2.
- Dividing polynomials by monomialsPR7 — Model, record, and explain the division of polynomial expressions by monomials, concretely, pictorially, and symbolically, limited to degree 2.
The official wording — 7 outcomes in this unit
- PR1
Generalize a pattern arising from a problem-solving context using linear equations and verify by substitution.
- PR2
Graph linear relations, analyze the graph and interpolate or extrapolate to solve problems.
- PR3
Model and solve problems using linear equations of the form: ax = b; a x = b , a ≠ 0; ax + b = c;
- PR4
Explain and illustrate strategies to solve single variable linear inequalities with rational coefficients within a problem-solving context.
- PR5
Demonstrate an understanding of polynomials (limited to polynomials of degree less than or equal to 2).
- PR6
Model, record and explain the operations of addition and subtraction of polynomial expressions, concretely, pictorially and symbolically (limited to polynomials of degree less than or equal to 2).
- PR7
Model, record and explain the operations of multiplication and division of polynomial expressions (limited to polynomials of degree less than or equal to 2) by monomials, concretely, pictorially and symbolically.
Unit 3Shape and SpaceOfficial strand · Strand SS
Circle properties, composite surface area, similarity of polygons, scale diagrams, and line and rotation symmetry.
Circle Properties
- Perpendicular from the centre bisects a chordSS1 — Solve problems and justify the solution strategy using the property that the perpendicular from the centre of a circle to a chord bisects the chord.
- Central angle equals twice the inscribed angleSS1 — Solve problems and justify the solution strategy using the property that the central angle is equal to twice the inscribed angle subtended by the same arc.
- Inscribed angles on the same arc are congruentSS1 — Solve problems and justify the solution strategy using the property that inscribed angles subtended by the same arc are congruent.
- Tangent is perpendicular to the radiusSS1 — Solve problems and justify the solution strategy using the property that a tangent to a circle is perpendicular to the radius at the point of tangency.
Surface Area, Similarity, and Symmetry
- Surface area of composite objectsSS2 — Determine the surface area of composite 3-D objects to solve problems.
- Similarity of polygonsSS3 — Demonstrate an understanding of similarity of polygons, including equal angles and proportional sides.
- Scale diagramsSS4 — Draw and interpret scale diagrams of 2-D shapes.
- Line symmetrySS5 — Demonstrate an understanding of line symmetry, including identifying and drawing lines of symmetry.
- Rotation symmetrySS5 — Demonstrate an understanding of rotation symmetry, including the order of rotation symmetry.
The official wording — 5 outcomes in this unit
- SS1
Solve problems and justify the solution strategy using circle properties, including: the perpendicular from the centre of a circle to a chord bisects the chord
- SS2
Determine the surface area of composite 3-D objects to solve problems.
- SS3
Demonstrate an understanding of similarity of polygons.
- SS4
Draw and interpret scale diagrams of 2-D shapes.
- SS5
Demonstrate an understanding of line and rotation symmetry.
Unit 4Statistics and ProbabilityOfficial strand · Strand SP
Factors affecting data collection, population versus sample, histograms, a staged data project, and the role of probability in society.
Data Collection and Histograms
- Factors affecting data collectionSP1 — Describe the effect of bias, use of language, ethics, cost, time and timing, privacy, and cultural sensitivity on the collection of data.
- Population versus sampleSP2 — Select and defend the choice of using either a population or a sample of a population to answer a question.
- HistogramsSP3 — Construct, label, and interpret histograms to solve problems.
Data Project and Probability in Society
- Designing the data investigationSP4 — Develop a project plan by formulating a question for investigation, choosing a data collection method that includes social considerations, and selecting a population or a sample.
- Collecting and displaying the dataSP4 — Implement the project plan by collecting the data and displaying it in an appropriate manner.
- Drawing conclusions from the dataSP4 — Analyze the displayed data and draw conclusions to answer the investigation question.
- The role of probability in societySP5 — Demonstrate an understanding of the role of probability in society.
The official wording — 5 outcomes in this unit
- SP1
Describe the effect of: bias; use of language; ethics; cost; time and timing; privacy; cultural sensitivity on the collection of data.
- SP2
Select and defend the choice of using either a population or a sample of a population to answer a question.
- SP3
Construct, label, and interpret histograms to solve problems.
- SP4
Develop and implement a project plan for the collection, display and analysis of data by: formulating a question for investigation; choosing a data collection method that includes social considerations; selecting a population or a sample
- SP5
Demonstrate an understanding of the role of probability in society.
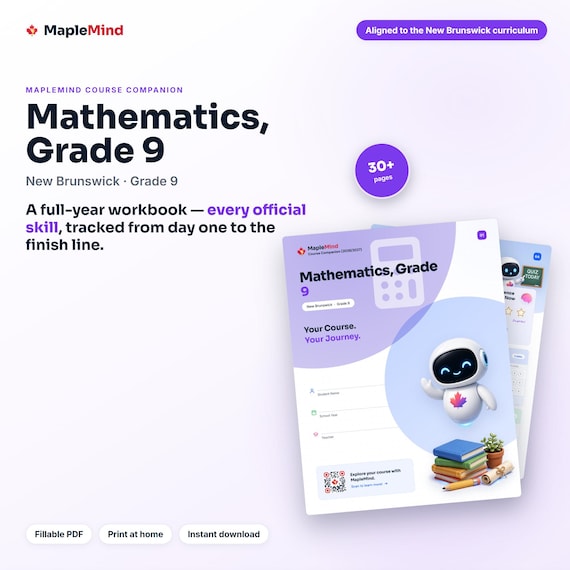
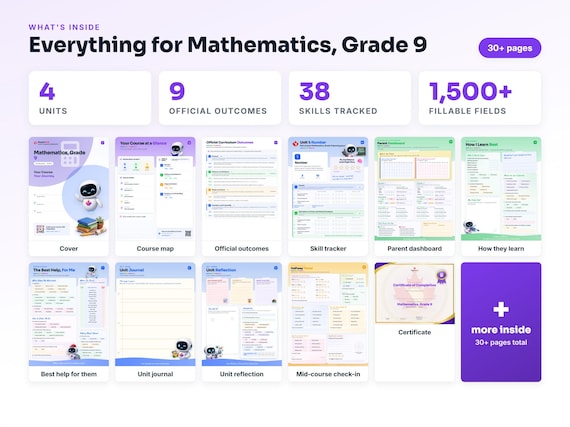

Printable workbook · A keepsake of the year
A Mathematics, Grade 9 workbook worth keeping
Built from the same official curriculum as this page. Before and after each skill above, your student colours in how sure they feel — so the two of you can see, on one page, what's clicking and what needs another look. It's a quiet way to follow how the year is really going.
By June it's full of their own handwriting: units worked through, confidence grown, a mid-year check-in, notes from parent-teacher night, and a certificate at the end. Less a worksheet, more a record of the year worth keeping on the shelf.
Instant download · see every page, reviews and the full description · five or more workbooks are $2.99 each
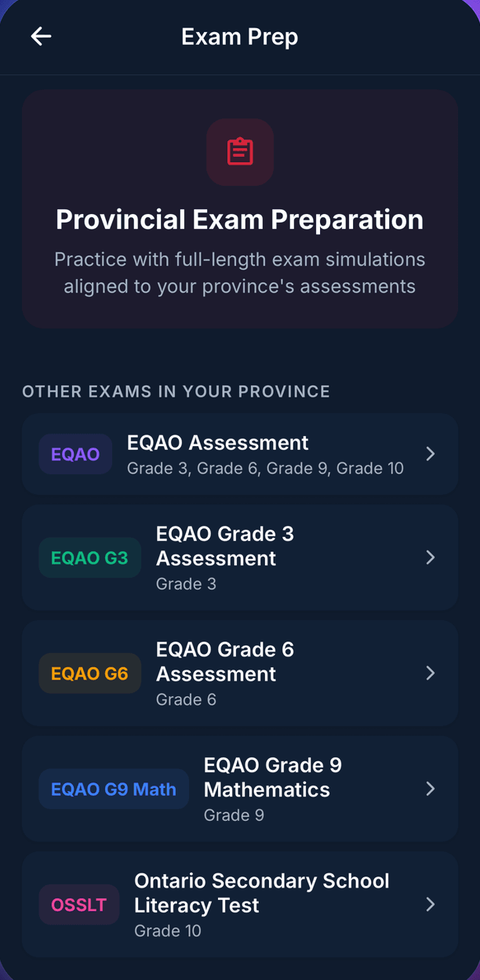
What it looks like in the app

Common questions
Can MapleMind help me with Mathematics, Grade 9?
Yes. MapleMind's AI tutor covers all 38 skills in New Brunswick's Mathematics, Grade 9 — you pick the exact skill, and the tutor teaches it step by step: a short lesson, a worked example, solving together, then a skill check to show it stuck.
Is MapleMind aligned to New Brunswick's official curriculum?
Yes. Every skill in this course maps to an official outcome code from New Brunswick's Grade 9 Mathematics curriculum, and the ministry's own wording is quoted under each unit on this page — with the official government source linked so you can check it yourself.
What does MapleMind cost?
It's free to start — 5 tutoring chats and a practice quiz every day, no credit card. A Pro subscription ($9.99/month or $49.99/year CAD, 7-day free trial) unlocks unlimited tutoring, practice, and exam simulations.
What if I'm stuck on just one topic?
That's the point of skill-level tutoring: open Mathematics, Grade 9 in the app, tap the exact skill from the list on this page, and the tutor teaches just that — no wading through lessons you don't need.
Does MapleMind work in French or other languages?
Yes — 14 languages, including French. Both the app and the tutor's explanations switch to the language you choose.
Where can I see the official New Brunswick curriculum for Mathematics, Grade 9?
The official source is linked on this page — New Brunswick's official K-12 education resources. The outline here follows it: every MapleMind skill carries its official outcome code, and the ministry's own wording is quoted under each unit.
Keep exploring
Ready when you are
Pick a skill from this page and see it taught properly — free, in the browser, in under a minute.